
Data-Driven B2B Market Analysis for Smarter Decisions
Turn GTM strategy into pipeline growth leveraging AI-driven TAM, SAM, and SOM market analysis and ICP design with account-level details to prioritize marketing and sales resources where opportunity is the greatest.
What Market Analysis Challenges Impact GTM Precision

Challenges
- Uncertain Market Size. Without accurate TAM insights, GTM strategy and budgets rely on assumptions instead of real data.
- Unclear ICP and Weak Segmentation. Teams struggle to pinpoint which customer traits or tech signals actually lead to conversions.
- Focus on Low-Value Segments. Teams chase high-volume segments with little spend or high competition.
- Not Enough Competitor Insights. Limited visibility into competitor installs and their strength across target segments.
- Delayed, Incomplete GTM Insights. Insights on market size, ICP, and opportunities remain siloed, delaying campaign activation and sales execution.

Solutions
- Data-Driven TAM Definition. Model your TAM with verified IT spend intelligence to uncover growth-ready opportunities.
- Customer-Driven ICP. Connect customer and win/loss data in AI models that reveal signals predictive of wins.
- Priority-by-Opportunity. Redirect focus toward segments with the highest revenue potential using spend, size, and competition data.
- Competitive Overlay. Identify growth opportunities by comparing your ICP and segments against competitive installs.
- Actionable Outputs. Turn market and account insights into actionable lists and campaigns instantly within HG platform.
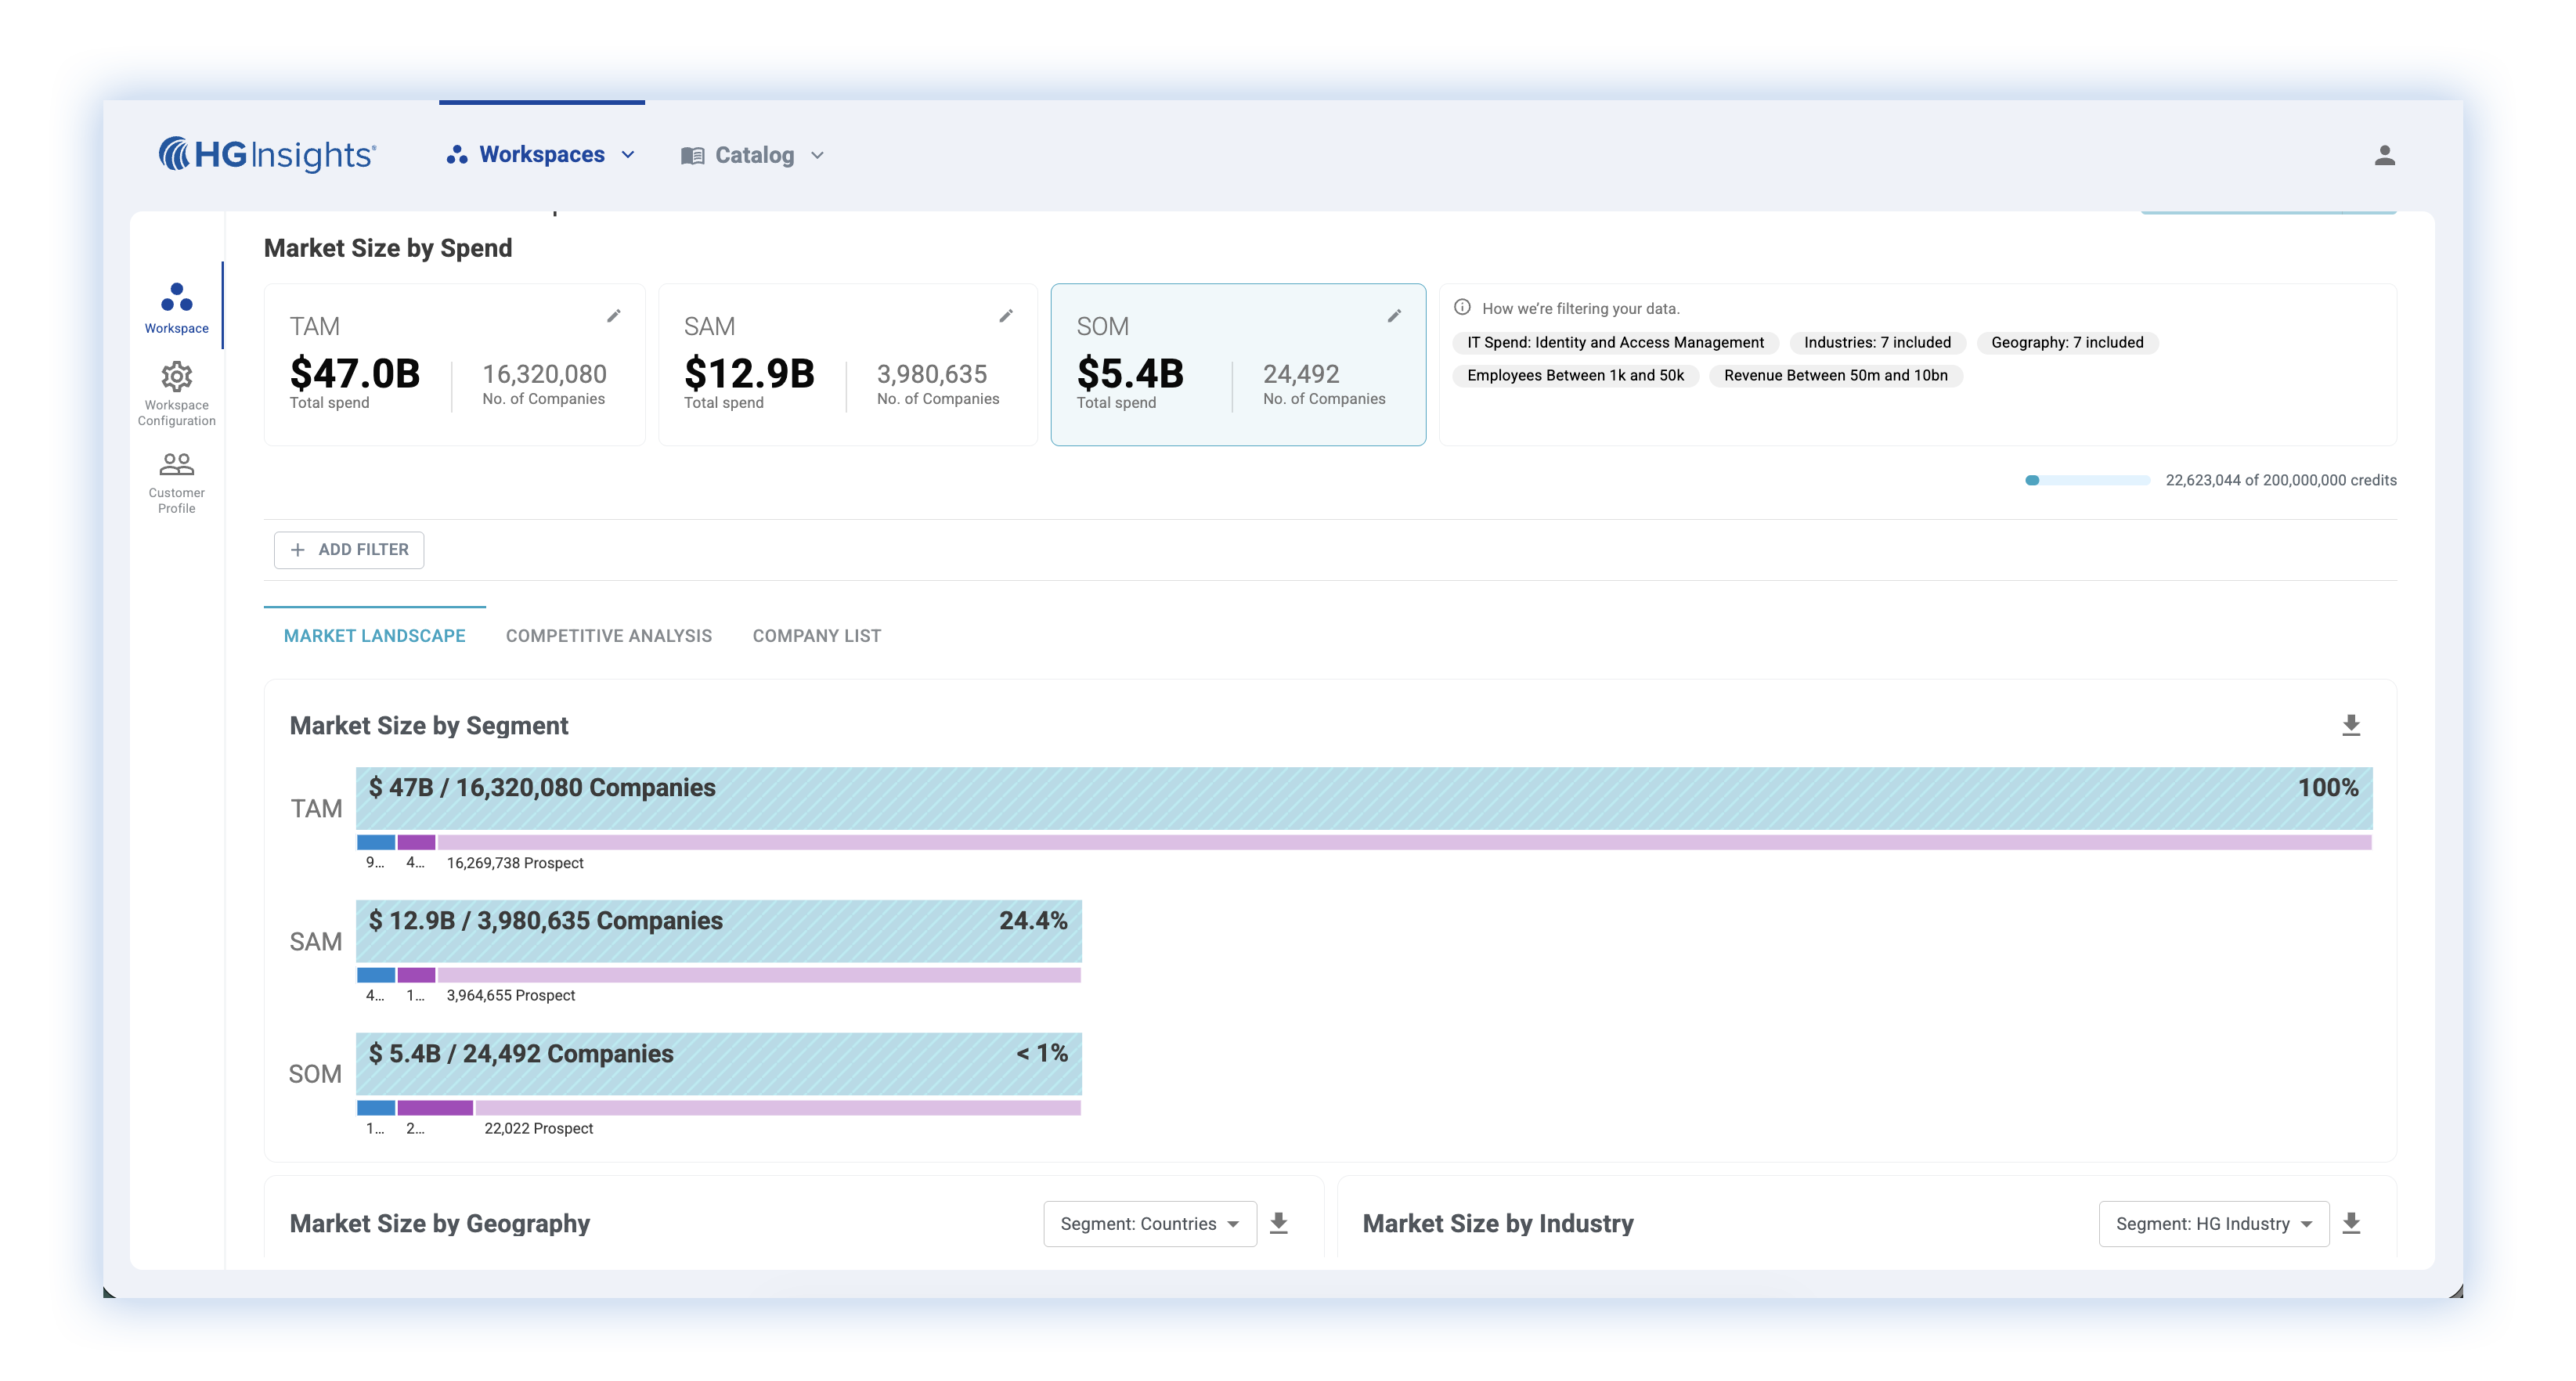
Essential Market Sizing Made Smart, Unified, and Actionable
HG Market Analyzer combines top-down IT spend modeling with bottom-up customer data to precisely define TAM, SAM, and SOM. Align strategy, marketing, and finance around one source of truth for growth planning.
Unified Dual Approach
Data-Driven Precision
Segment Prioritization
Competitive Visibility
Faster Planning
How Hyland Software Unlocks Precision in B2B Marketing with HG Insights
“The technographic, competitive, and IT spend insights all feed into our ICP scoring model. This allows us to prioritize accounts effectively for each play and ensure sales and marketing are aligned. With AI, we can react instantly when a potential customer shows intent -acting at the right moment with context.”
Joe Hannun | Sn. Manager, Customer Intelligence, Analytics, Hyland Software
How HiBob Uses HG To Improve Their Entire Go-To-Market
“The quantity and quality of the HG Insights data was viewed as more comprehensive and more reliable.”
Will Vasquez Global Director | Account-Based GTM Strategies, HiBob
How HG Insights Empowers Informatica To Be More Effective and Efficient
“We have all the usual suspects in terms of data providers, but HG is my favorite. It has a very actionable approach to being able to leverage the data.”
Gigi Gazelle Urquico | Senior Director, Revenue Enablement, Informatica
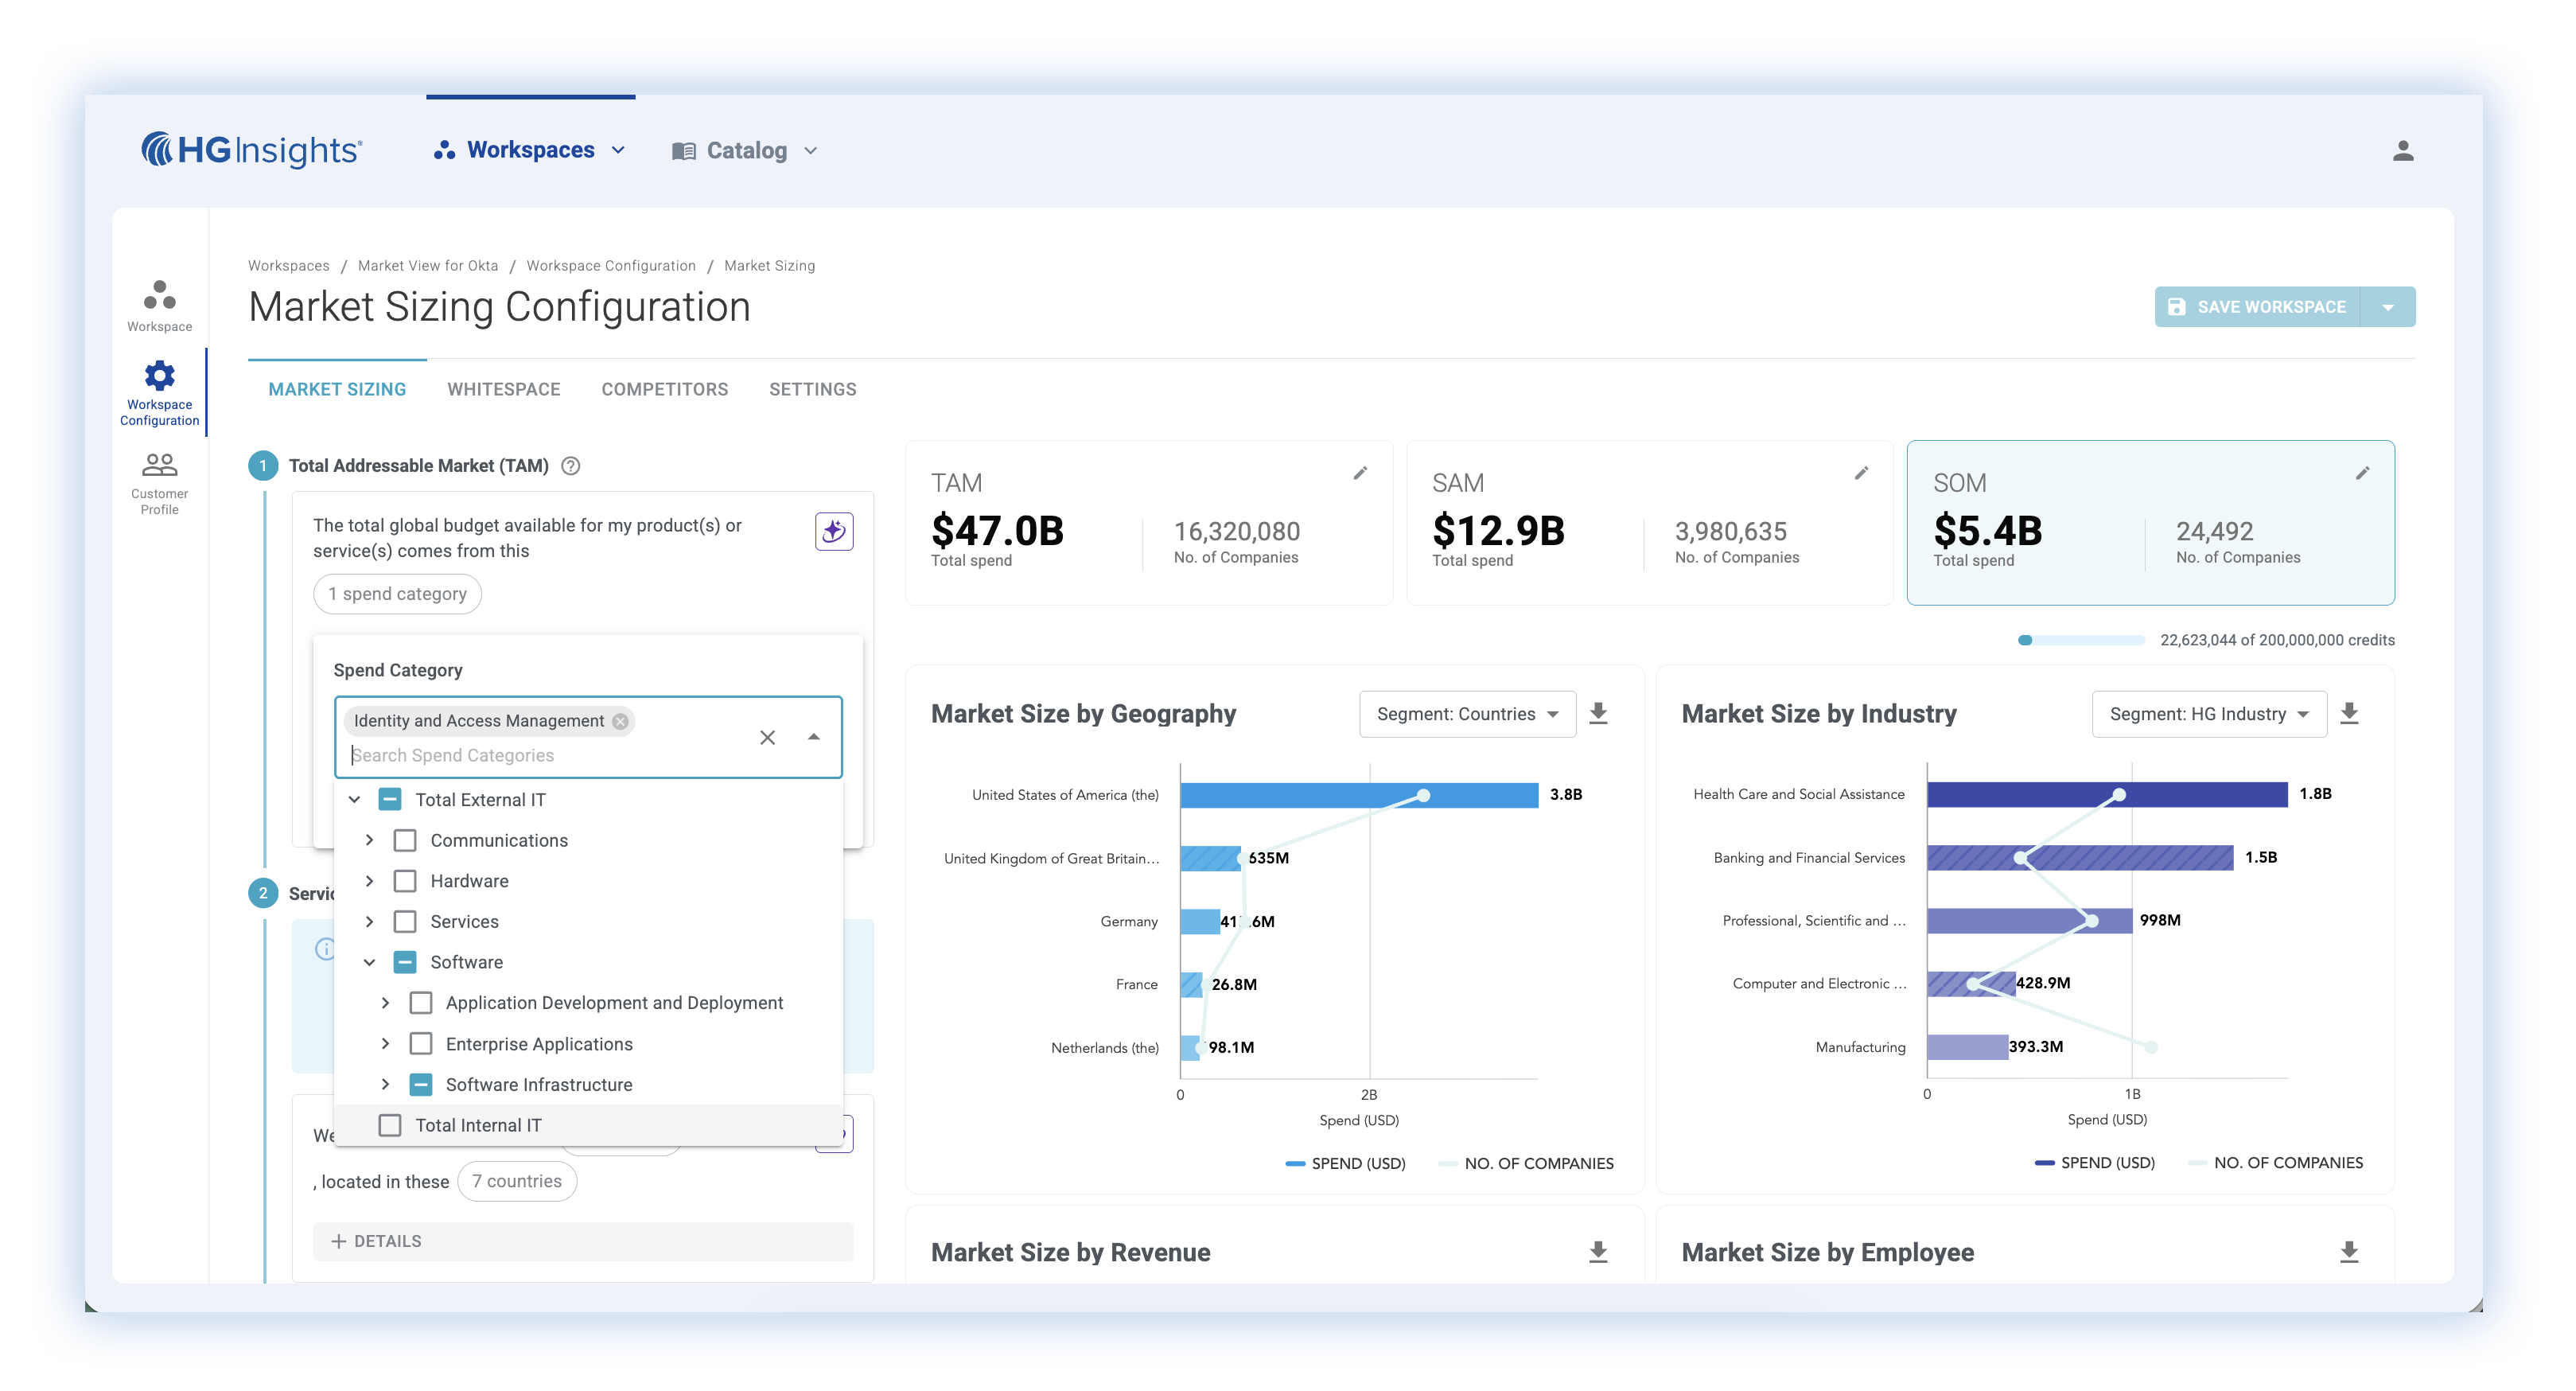
What Are the Key Steps for Effective Market Sizing, ICP Design and Segmentation Insights
Define your market precisely leveraging a guided top-down and bottom-up process. Copilot assists through every stage, from IT spend selection to validated TAM, SAM, and SOM visualization.
Start with top-down industry and spend data to ensure TAM accuracy.
- Choose from 140+ IT spend categories.
- Filter by industry, geography, and company size.
- Build a clear TAM baseline with validated spend data.
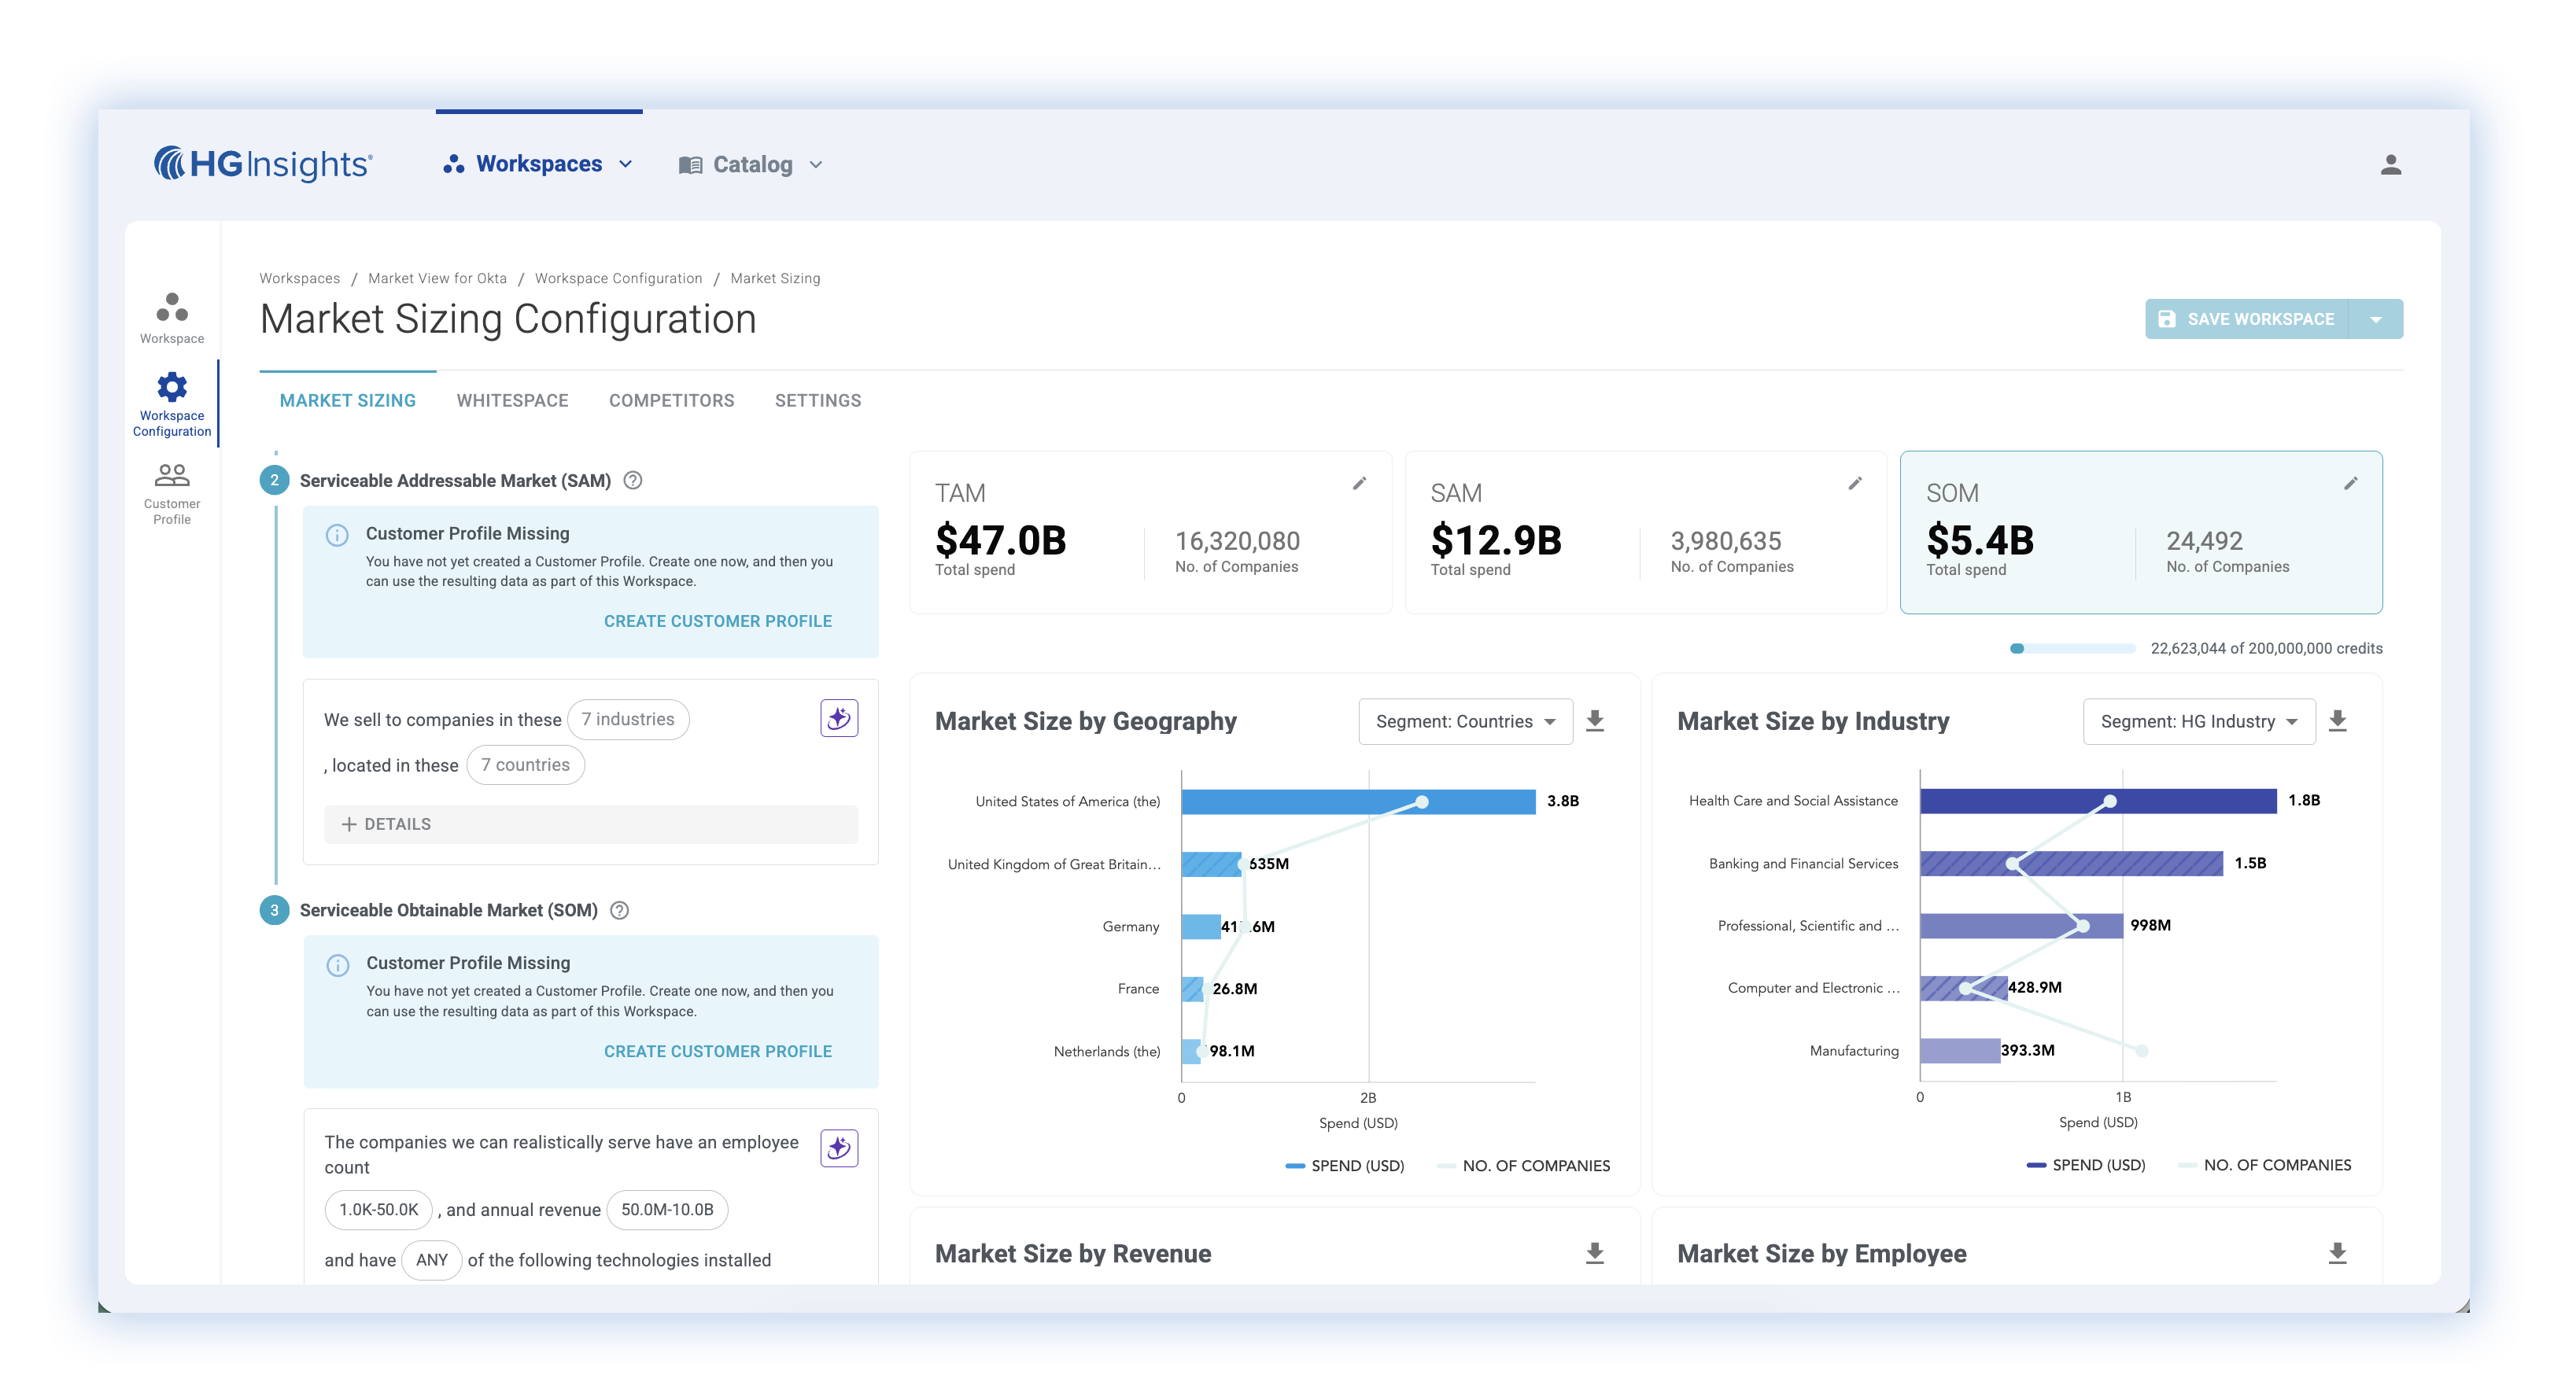
Refine TAM into serviceable and obtainable market segments.
- Apply geography, vertical, and tech filters.
- Use AI to optimize segment sizing.
- See your refined SAM and SOM instantly.
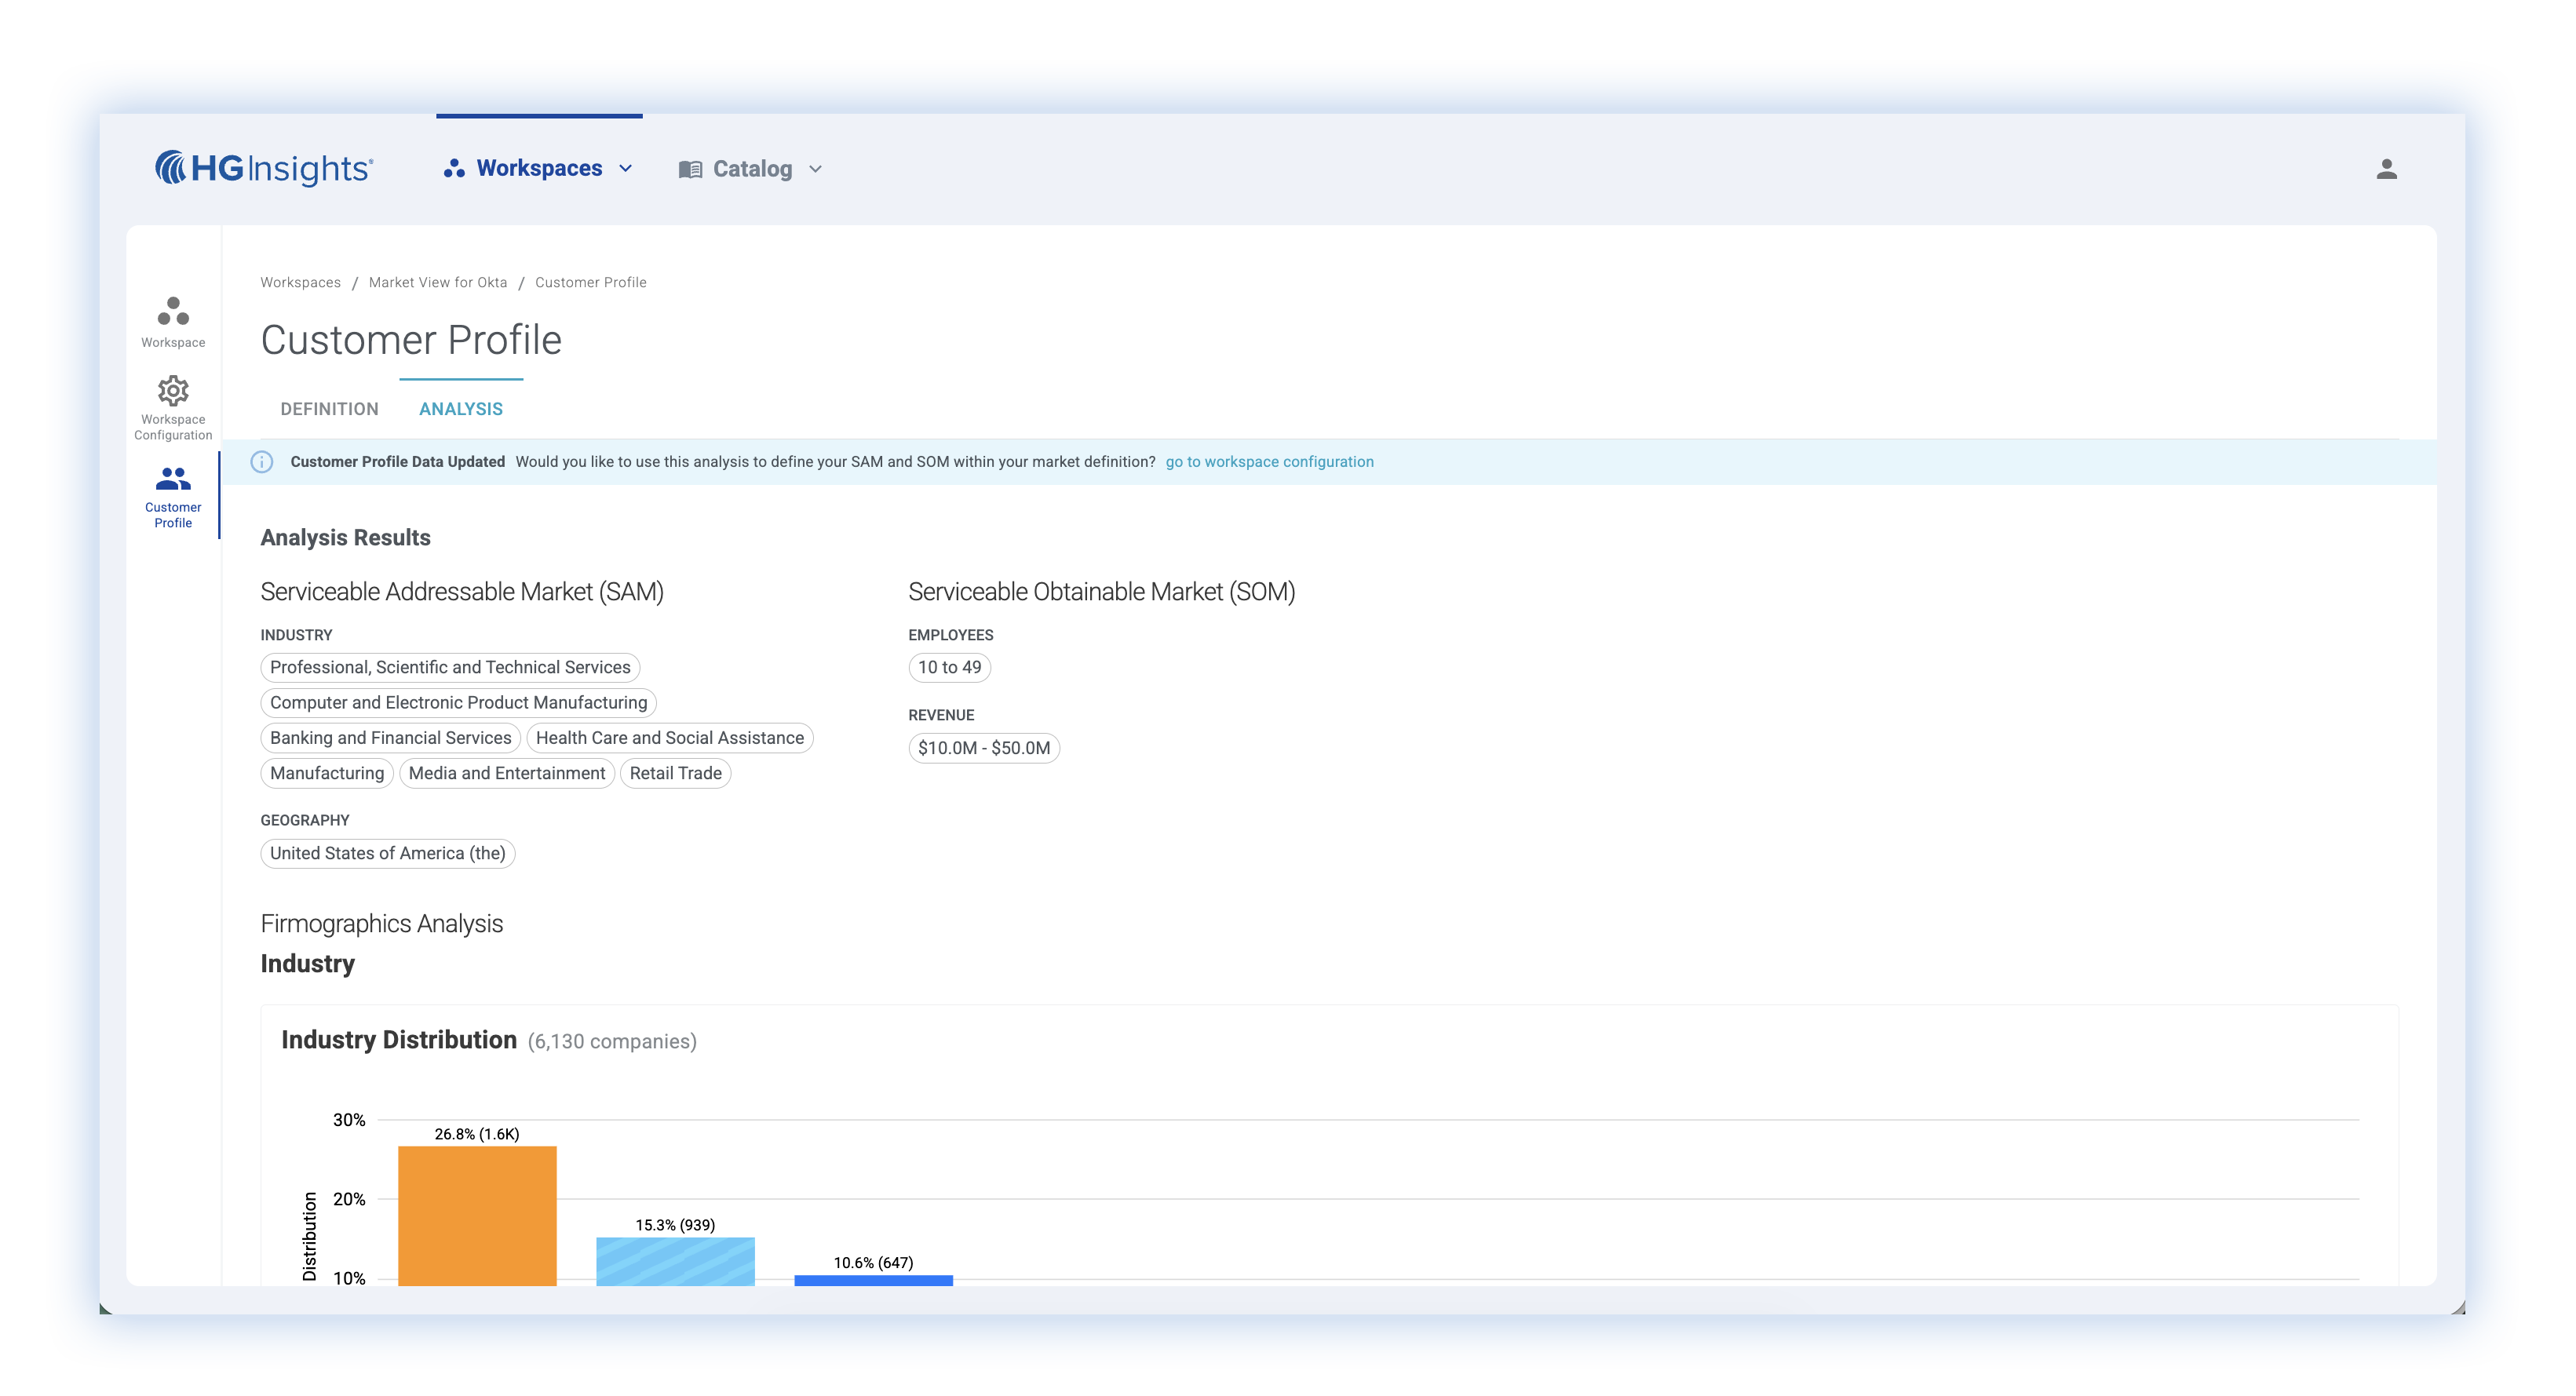
Bring in bottom-up data for stronger, reality-based models.
- Upload customer or win/loss data.
- Detecting key success traits.
- Validate market size with real outcomes.
Turn insights into dynamic charts and ready-to-use outputs
- AI Copilot builds charts automatically.
- Export visuals for leadership review.
- Move from model to GTM execution faster.
FAQ: Market Sizing, ICP Design, and Segmentation Insights
How does HG Insights combine top-down and bottom-up analysis?
The platform merges global IT spend data with your customer insights. Top-down modeling defines TAM and SAM by industry and region, while bottom-up inputs validate SOM using real success patterns. Together, this unified view ensures every market model reflects verified and actionable opportunities.
What data sources power the market models?
HG Insights uses 28B+ datapoints across 140+ IT categories, company firmographics, and technology adoption patterns. When combined with your CRM and win/loss data, it provides a unified and verified market foundation.
Do I need technical skills to build a model?
No. The AI Copilot guides you step by step through category selection, data uploads, and model visualization. You can build and refine your TAM, SAM, and SOM in minutes without data science expertise.
What ROI can we expect from HG’s competitive insights?
Customers typically see higher win rates on competitive deals (25-30% improvement), lower cost-per-opportunity by focusing on in-market prospects, and faster sales cycles by targeting accounts with known observability needs.
Is HG Insights compliant and secure for enterprise use?
Absolutely. HG Insights maintains enterprise-grade security and privacy practices with SOC 2 and GDPR compliance, and procurement-ready documentation. All competitive intelligence is gathered through legitimate, transparent methods with full data lineage tracking.
Schedule Custom Demo