Key Takeaways:
- $76.1 billion in projected spending in the IoT market over the next 12 months
- 33% of spending on IoT solutions comes from buyers in the United States
- Telefonica, Schneider Electric, and Xylem are the top three IoT vendors by number of installations
- Three-quarters (73%) of spending on IoT solutions comes from companies with more than 1,000 employees
- The sectors that spend the most in the IoT market are Finance & Insurance, Manufacturing, and Healthcare & Social Assistance
HG data projects that $76.1 billion will be spent on the global Internet of Things (IoT) market over the next 12 months. IoT devices are physical objects that are inserted with software or other mechanisms that allow them to communicate autonomously over the internet.
Because these IoT systems and devices can communicate without human intervention, the implications for business innovation and operational efficiency are seemingly endless, as are the use cases – from smart homes to smart cities and everything in between.
HG’s comprehensive view of the IoT market leverages proprietary insights from our Market Intelligence platform. This report offers an in-depth Internet of Things market analysis into global spending trends, leading IoT vendors, and buyer profiles.
Internet of Things Market Size
According to HG’s data, the global IoT market size is projected to reach $76.1 billion in total spend in the next 12 months. Our analysis covers the 9M+ companies in the HG database (this data includes only businesses with registered addresses).
IoT Market Size by Category
| Category | Spend | Market Share |
| Smart Health (Medical and Healthcare Application) | $7,439,993,504 | 9.3% |
| Smart Energy (Energy Management Application) | $9,049,019,900 | 11.3% |
| Smart Factory / Industry 4.0 (Manufacturing Application) | $11,186,782,647 | 14.0% |
| Smart Transportation / Car IT (Transportation Application) | $15,397,474,223 | 19.3% |
| Industry-Specific IoT Applications | $36,816,039,434 | 46.1% |
HG Insights divides IoT into five categories, with Industry-Specific IoT Applications making up nearly half (46%) of the IoT market size. The other categories are:
- Smart Transportation / Car IT – 19% market share
- Smart Factory / Industry 4.0 – 14% market share
- Smart Energy – 11% market share
- Smart Health – 10% market share
IoT Market Size by Region
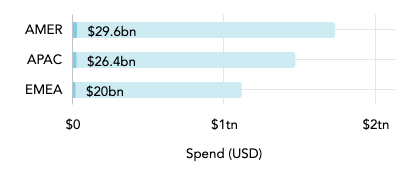
This chart shows the IoT market size (dark blue) compared to total IT spend (light blue) in each region. Companies in AMER (North America, Central America, and South America) spend the most on IoT solutions – $29.6 billion – out of all three regions, accounting for 39% of all spend. APAC (Asia Pacific) and EMEA (Europe, Middle East, and Africa) make up 35% and 26% of global IoT spending, respectively.
Top 10 Countries by IoT Market Spending
| Country | Total Spend | Companies |
| United States | $25,372,582,813 | 4,246,717 |
| China | $10,956,830,176 | 179,779 |
| Japan | $4,981,211,751 | 161,175 |
| United Kingdom | $3,953,658,117 | 628,705 |
| Germany | $3,394,914,161 | 399,047 |
| India | $2,522,541,040 | 266,591 |
| Republic of Korea | $2,001,617,944 | 35,885 |
| Canada | $1,985,232,317 | 394,679 |
| France | $1,784,204,233 | 202,134 |
| Netherlands | $1,650,601,718 | 165,631 |
According to HG’s data, there are more than 4.2 million companies in the United States expected to spend $25 billion on IoT technology during the forecast period, accounting for one-third (33.4%) of the total IoT market size. China, Japan, and the United Kingdom are the three next largest markets, making up 14%, 7%, and 5% of global IoT spending, respectively.
IoT Market Share
We analyzed our Market Intelligence data to answer important IoT market share questions: Who is buying IoT solutions, and from whom? This section reveals the top vendors and products by the number of detected installations.
Leading Vendors by IoT Market Share
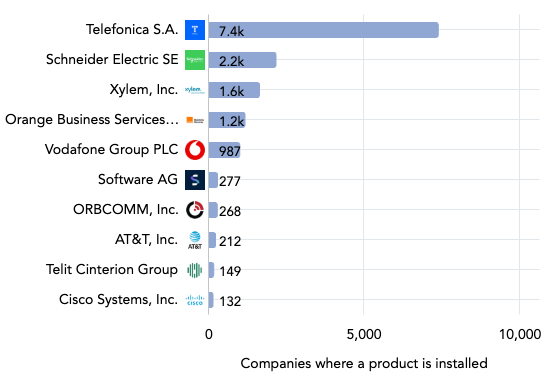
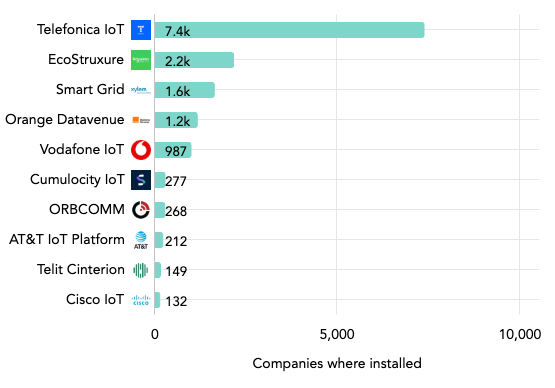
This chart illustrates the 10 key players in IoT by their global customer count. To ensure our data is both accurate and actionable, we include only businesses with registered addresses in its data analysis and market insights.
Telefonica – a telecom company headquartered in Madrid, Spain – claims the largest share of the IoT market with 7,372 detected installs. Schneider Electric and Xylem claim the next two spots with 2,154 and 1,624 installs, respectively.
The Top 10 IoT Solutions
This chart displays the 10 leading IoT solutions by number of customers. All 10 products align exactly – in the same order – with their respective vendors on the previous list.
Buyer Landscape of the Internet of Things Market
As digital transformation infiltrates every aspect of our lives, more connected devices and IoT platforms are emerging in the market, and more buyers are seeking them out. This section dives deeper into IoT market trends and the buyer landscape – specifically the number of buyers by industry and company size, as well as how much they’re spending on IoT solutions.
IoT Market Spend by Buyer Size (Revenue)
| Revenue | Total Spend | Companies |
| $5bn+ | $36,282,168,704 | 6,169 |
| $1bn to $5bn | $15,437,807,633 | 21,529 |
| $500m to $1bn | $5,990,208,926 | 28,310 |
| $200m to $500m | $7,141,500,782 | 65,440 |
| $100m to $200m | $4,726,754,825 | 90,543 |
| $50m to $100m | $3,723,655,132 | 169,162 |
| $10m to $50m | $1,675,046,031 | 989,336 |
| $1m to $10m | $302,893,967 | 4,188,732 |
| Less than $1m | $58,940,332 | 2,162,127 |
About half of spending in the IoT market comes from 6,169 companies in the highest revenue tier ($5 billion and above). The next largest bucket consists of the 21,529 companies earning between $1 – $5 billion, accounting for 20% of spending on IoT solutions.
Companies making up to $10 million in revenue account for only 0.5% of IoT spending, but there are nearly 6.4 million of them – the vast majority of IoT buyers – illustrating strong demand in the market even among smaller businesses.
IoT Market Spend by Buyer Size (Number of Employees)
| Employees | Total Spend | Companies |
| 10,000+ | $30,814,107,139 | 12,986 |
| 5,000 to 9,999 | $7,485,205,110 | 14,167 |
| 1,000 to 4,999 | $17,130,625,422 | 99,808 |
| 500 to 999 | $5,923,779,527 | 92,600 |
| 200 to 499 | $5,858,778,745 | 311,631 |
| 50 to 199 | $4,547,151,803 | 910,225 |
| 1 to 49 | $2,248,135,196 | 5,513,634 |
As with most IT categories, market trends for spending tend to be aligned across both measures of company size (number of employees and revenue). While fewer companies exist in the larger tiers, those organizations tend to spend more on IoT solutions (and on IT in general).
HG’s data indicates that nearly three-quarters (73%) of total spending in the IoT market comes from companies with more than 1,000 employees.
IoT Market Spend by Industry
| Industry | Total Spend | Companies |
| Finance and Insurance | $26,600,723,597 | 332,256 |
| Manufacturing | $16,794,298,575 | 678,481 |
| Healthcare and Social Assistance | $7,571,738,075 | 357,136 |
| Public Administration | $6,496,664,430 | 185,030 |
| Professional, Scientific, and Technical Services | $3,547,785,794 | 1,305,255 |
| Transportation and Warehousing | $3,402,828,184 | 119,251 |
| Utilities | $2,719,147,841 | 30,205 |
| Information | $2,301,690,484 | 426,152 |
| Retail Trade | $1,769,288,962 | 397,243 |
| Wholesale Trade | $1,388,401,040 | 254,284 |
| Educational Services | $1,123,457,204 | 230,920 |
| Administrative and Support and Waste Management and Remediation Services | $774,637,183 | 263,668 |
| Mining, Quarrying, and Oil and Gas Extraction | $557,995,231 | 33,815 |
| Construction | $288,787,058 | 304,678 |
| Arts, Entertainment, and Recreation | $248,178,539 | 242,135 |
| Real Estate and Rental and Leasing | $225,213,963 | 211,325 |
| Accommodation and Food Services | $131,043,883 | 205,386 |
| Other Services (except Public Administration) | $66,427,583 | 436,069 |
| Agriculture, Forestry, Fishing and Hunting | $58,193,678 | 37,140 |
According to HG’s data, the Finance & Insurance, Manufacturing, and Healthcare & Social Assistance sectors spend the most in the IoT market, accounting for 67% of the overall spend.
Looking at the combination of total spend and number of companies can provide deeper insight on spending in a specific industry. Take the Professional, Scientific, and Technical Services sector, for example. It has the fifth highest spending on IoT ($3.5 billion), but those dollars are spread across 1.3 million buyers, giving it relatively low average spend per company.
Meanwhile, the Utilities sector has 30,205 buyers spending more than $2.7 billion – the highest average spend of any industry.
Uncover IoT Market Opportunities with HG Insights
HG Insights’ Revenue Growth Intelligence data enables go-to-market (GTM) teams to drill down into the size, shape, and structure of their target markets. Our Platform helps businesses analyze vendor penetration, easily conduct TAM SAM SOM analysis to size market opportunities, uncover white space, and identify and prioritize the best-fit accounts – all on one unified platform.
Reach out to see your ICP accounts and spot opportunities in the IoT market.