

For most GTM teams, account fit starts with the familiar filters: company size, market category, annual revenue, regional coverage. You build the list, hand it to sales, and expect the pipeline to follow. Then conversion slows. Sales loses confidence in the scoring model. Marketing can’t explain why the accounts everyone agreed on aren’t moving.
The filters weren’t wrong. They were just incomplete. Firmographics describe what a company looks like. Technographic data shows how that company actually operates, which systems it already runs, and where there’s an opening for a better solution. That difference is the gap between a list that looks good in a spreadsheet and a list that closes.
Here is how to use technographic signals to define best-fit accounts, score them, and put the result to work before pipeline momentum stalls.
Why a firmographic-only definition of fit falls short
Firmographics narrow the market. They don’t explain buying readiness. Industry, headcount, and revenue describe the shape of an account, not how the business runs or whether it’s ready to move.
Picture two accounts in the same vertical, with the same employee count and similar revenue. On paper, identical. One runs a mature ecosystem of complementary tools, has a competing vendor installed, and holds budget for the category. The other lacks the technical maturity to adopt your product without a long education cycle. Same tier in the CRM. Completely different outcomes.
Sales feels that difference first. A rep works two “Tier 1” accounts the same way and watches one progress while the other stalls. The problem usually isn’t the rep. It’s that the fit model didn’t carry enough evidence to tell the two accounts apart.
HG Insights data across US mid-market companies illustrates this directly: nearly as many companies with 100–999 employees run more than 150 installed technologies (21%) as run fewer than 10 (23%). Two companies at the same headcount can operate in completely different technology environments, and firmographics will never tell you which is which.
What technographic data tells you that firmographics cannot
Technographic data gives your team a read on account behavior. It shows which technologies a company uses, which categories it has already invested in, and where the current stack leaves room for your product. The scale of that signal is larger than most teams assume: HG Insights data shows that mid-market companies in the US run an average of 101 installed products, while enterprise organizations average more than 1,400. Stack depth is not a byproduct of company size, it is a distinct signal about how a company buys and operates technology.
A stack points to integration paths, signals how established a company’s technology category is, and shows where change is realistic. An account running tools that connect naturally to your product may be quick to activate. An account already running a competitor has validated the problem you solve and paid to address it. An account with several systems in a related category often has the budget, process maturity, and urgency your team is looking for.
HG Insights combines verified technology installs, IT spend projections, and contract timing across millions of accounts, giving GTM teams a read on environment, capacity, and renewal windows in a single view rather than stitching together three separate data sources.
Buyers are also forming opinions earlier than most account strategies assume. Forrester found that 41% of buyers had a single vendor in mind at the start of the purchase process, and 92% already had a shortlist. If your strategy waits for late-stage engagement to act, the account has likely already decided who it’s considering, and your team is behind before the first conversation.
Building a best-fit profile from your existing customer base
Reliable best-fit identification starts with the customers already proving value. Look at the accounts with the fastest sales cycles, the highest ACV, the strongest retention, and the healthiest expansion. Then study the stack patterns they share.
You’ll often find that top customers cluster around the same CRM, cloud provider, data warehouse, security tooling, or marketing automation platform. You’ll also find negative patterns, the stack combinations that slow adoption or flag low category maturity. Both are useful. One tells you where to lean in, the other tells you where to slow down.
Those patterns turn a static ICP into a working technographic ICP. Product marketing gets sharper positioning. RevOps gets better scoring inputs. Sales gets a concrete reason to prioritize one account over another. When your team can build Customer Fit models in HG Insights’ Data Studio using technographic, firmographic, and IT spend signals drawn from your own closed-won data, ICP refinement becomes a repeatable operating discipline instead of a once-a-year planning exercise.
Scoring accounts against the technographic ICP
Technographic account scoring works best alongside firmographic, behavioral, spend, and intent inputs. Firmographics tell you whether the account belongs in the market. Technographics for account targeting tell you whether the account’s environment makes your offer relevant right now.
A useful model weights the signals that matter most to your specific motion. A competitor install might carry heavy weight in a displacement campaign. A complementary technology might matter most for an integration-led play. A weak or missing category stack might lower priority even when the company looks right on paper.
HG Insights’ scoring models are transparent by design. Each scored account surfaces the specific signals driving the result, so reps understand why an account ranks where it does and act on it rather than second-guessing the output.
Tiered scoring keeps the output usable. Separate your must-work accounts, nurture accounts, expansion candidates, and poor-fit accounts so your team isn’t forcing every prospect into the same play. The goal isn’t a single ranked list. It’s a set of clear instructions about where effort should go.
| Signal | Displacement play | Integration-led play | Whitespace and education play |
|---|---|---|---|
| Competitor install | High | Low | Low |
| Complementary technology install | Low | High | Medium |
| Category stack depth | Medium | Medium | Low |
| Firmographic fit | Medium | Medium | Medium |
| Buyer intent activity | High | High | Medium |
| IT spend and budget capacity | High | Medium | Medium |
| Contract or renewal timing | High | Low | Low |
Surfacing displacement opportunities through competitive installs
Competitive installs deserve special attention because they prove category awareness. An account running a competing product already understands the problem, has allocated budget, and has trained its users around a process. The hard part, convincing them the category matters, is already done.
HG Insights pairs verified competitor installs with contract and renewal timing data, so your team finds those accounts with precision and knows which ones are approaching a decision window where a switch is realistic.
The strongest displacement plays don’t treat the competitor as the whole story. They connect the install to the likely pain points, migration concerns, integration needs, and business outcomes your team can speak to directly. The install gets you in the room. The specifics win the deal.
Adding intent and spend signals for in-market validation
Technographics confirm fit. Intent confirms timing. IT spend confirms capacity. You need all three to separate an attractive account from a realistic one.
The gap matters more than most teams expect. HG Insights data shows that within the US mid-market, nearly half of companies allocate more than $2 million annually to IT, while 13% spend less than $500,000. Same headcount range, very different buying capacity. A perfect stack match might still not be ready to buy, and a high-intent account might lack the budget to move this quarter. IT spend context tells you which is which. Once the fit model is clear, pair technographic fit with active buying signals so reps know which accounts deserve attention now rather than next year. Account prioritization with technographics gets stronger when your team can see both the environment and the buying motion around it.
Segmenting best-fit accounts for differentiated plays
A best-fit list shouldn’t collapse into one generic campaign. Technographic segmentation gives your team a smarter way to group accounts around what’s actually happening in the stack.
Competitor-install accounts need displacement messaging. Complementary-stack accounts need integration and value-expansion messaging. Category-mature accounts may respond to performance, consolidation, or efficiency plays. Whitespace accounts may need education that ties the problem to the systems they already run. Those segments give marketing better offers, give SDRs a reason to personalize outreach, and let sales leaders assign the right play to the right account.
| Account segment | Primary stack signal | Recommended play | Messaging focus |
|---|---|---|---|
| Competitor-install accounts | A competing product is already installed | Displacement | Migration path, integration concerns, and the business outcomes your product delivers over the current vendor |
| Complementary-stack accounts | Tools that connect naturally to your product are installed | Integration and value expansion | Fast activation, ecosystem fit, and added value on top of the existing stack |
| Category-mature accounts | Several systems in a related category | Consolidation or efficiency | Performance gains, tool consolidation, and process maturity |
| Whitespace accounts | Little or no category stack | Education | Tying the problem to the systems they already run, and building category awareness |
Validating coverage with whitespace and TAM analysis
B2B account fit analysis shouldn’t stop once the score is built. Your team still needs to know whether high-fit account selection is actually reflected in territories, campaigns, and pipeline coverage.
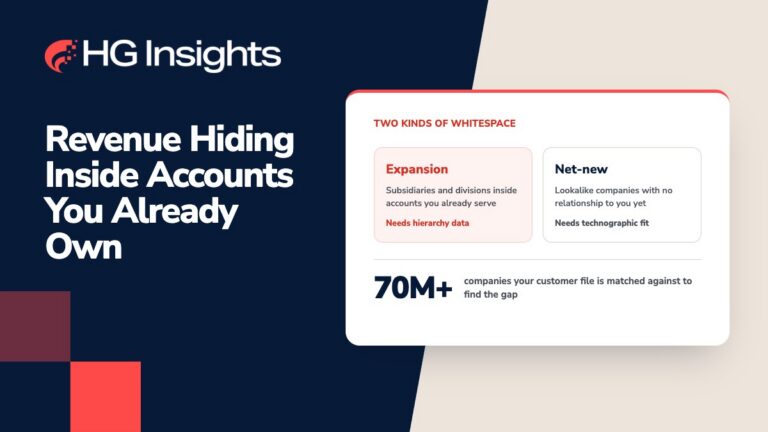
Whitespace analysis can show which high-fit accounts are missing from active programs. TAM analysis can reveal underworked segments where the stack signals are strong but sales coverage is thin. Together, they turn your technographic ICP into a planning tool for pipeline generation, territory design, and ABM optimization, not just a scoring exercise that ends in a spreadsheet.
Keeping the best-fit definition alive
Tech stacks change. Vendors get replaced, budgets shift, and new categories appear. A model that looked accurate six months ago drifts as account signals move and old assumptions stop matching how buyers actually behave.
Refresh your technographic inputs and scoring weights on a regular cadence, and especially after major product changes, pricing shifts, new market pushes, or a change in win-loss patterns. Best-fit ICP modeling works because it reflects the market as it is now, not as it looked during last year’s planning cycle.
Why HG Insights supports best-fit account identification
95% of Fortune 1000 B2B tech companies and all major hyperscalers rely on HG Insights. We help your team move past surface-level fit with verified technology installs, IT spend, contract intelligence, and account-level signals delivered through the Revenue Growth Intelligence Platform.
We help sales, marketing, RevOps, and strategy teams find the accounts that fit, fund, and show signs of movement. Richer data improves ICP accuracy, scoring confidence, segmentation quality, and whitespace planning, so reps know exactly where to direct their effort.
See how the Revenue Growth Intelligence Platform brings together technographic installs, IT spend, and contract intelligence to identify your best-fit accounts. Then book a demo to see it applied to your ICP.
Frequently asked questions
What does best-fit mean in B2B account targeting?
A best-fit account is one whose environment, behavior, and capacity make your product relevant, not just a company that matches your firmographic profile. It combines the shape of the business (industry, size, revenue) with how the business operates (its tech stack, category maturity, and buying signals) to identify accounts most likely to convert, retain, and expand.
How does technographic data improve best-fit account identification?
Technographic data shows what an account actually runs, which exposes integration paths, competitive installs, and category maturity that firmographics can’t see. That lets your team distinguish two companies that look identical on paper but have very different buying readiness, so scoring and prioritization reflect real opportunity rather than surface attributes.
What is the difference between firmographic and technographic data?
Firmographic data describes a company’s characteristics, such as industry, employee count, revenue, and location. Technographic data describes the technologies a company uses, including its installed software, infrastructure, and the categories it has invested in. Firmographics tell you whether an account belongs in your market. Technographics tell you whether its environment makes your offer relevant.
How do you build a technographic ICP from existing customers?
Start with your highest-value customers, the accounts with the fastest sales cycles, highest ACV, strongest retention, and healthiest expansion. Identify the stack patterns they share, along with any negative patterns that signal slow adoption. Translate those patterns into scoring inputs so your ICP reflects the technology signals your best customers actually have in common.
How can technographic data support competitive displacement strategies?
Accounts running a competing product have already recognized the problem, allocated budget, and trained users around a process, which makes them one of the most reachable best-fit segments. Technographic install data identifies those accounts, and layering contract or renewal timing on top shows which ones are approaching a decision window where a switch is realistic.
Should technographic data be combined with intent and spend signals?
Yes. Technographics confirm fit, intent confirms timing, and spend confirms capacity. A strong stack match may not be ready to buy, and a high-intent account may lack the budget to move. Combining all three separates accounts that fit from accounts that are both a fit and in-market, which sharpens prioritization.
How often should a best-fit account definition be refreshed?
Refresh it on a regular cadence, since tech stacks, budgets, and categories shift continually and a static ICP decays. Beyond a routine schedule, update technographic inputs and scoring weights after major product changes, pricing shifts, new market pushes, or a noticeable change in win-loss patterns.
How does HG Insights support best-fit account identification?
HG Insights provides verified technology installs, IT spend, contract intelligence, and account-level signals through the Revenue Growth Intelligence Platform. That data supports ICP modeling, account scoring, segmentation, whitespace planning, and ongoing refresh, helping sales, marketing, RevOps, and strategy teams find accounts that fit, fund, and show signs of movement.