Territory planning software is supposed to solve a fairness problem: which rep owns which accounts, and is the split even. Most platforms answer that question well and then stop. They draw a map, assign accounts, and leave the assignment untouched until the next planning cycle, even as the accounts inside that map change by the week. RevOps teams that connect territory data to live buying signals get something different: a ranked list of accounts inside each territory that tells a rep where to spend the next hour, not just which region they cover.
Quick Answer: Territory planning software assigns accounts to reps using firmographic and geographic rules, but it doesn’t update when a specific account starts showing buying intent. Pairing territory data with signal-based account prioritization, ranking every account inside a territory by technographic, intent, and installed-base signals, turns a static map into a workflow that stays current between planning cycles instead of going stale the week after it’s drawn.
What territory planning software does, and what it misses without buying signals
Territory planning software takes firmographic inputs, employee count, industry, revenue, region, and turns them into a set of rules that assign named accounts to reps so coverage is even and quota is fair. What it doesn’t do on its own is tell a rep which of those assigned accounts is worth calling this week. Assignment answers who owns an account. It doesn’t answer why now.
What territory planning software actually does
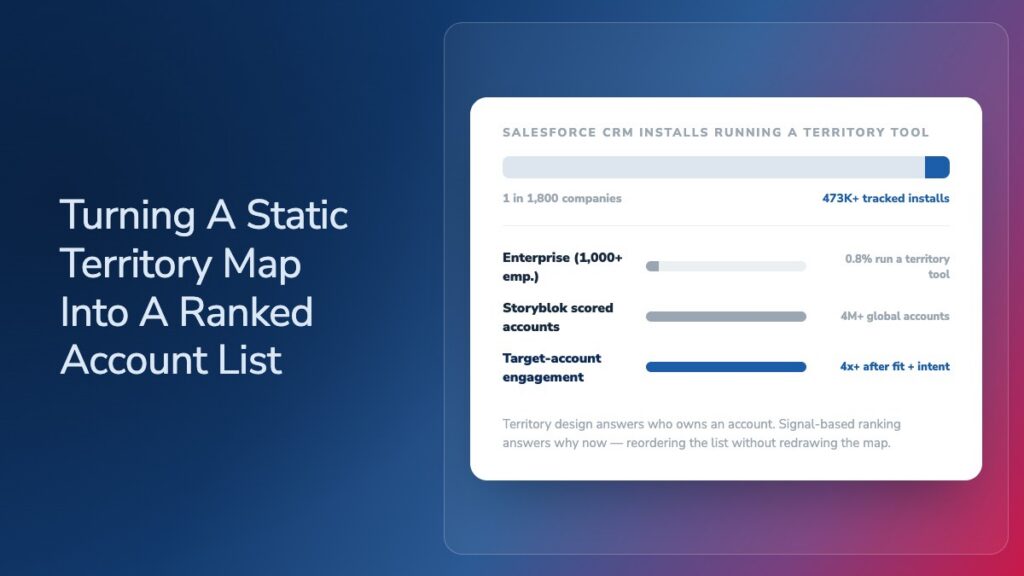
At its core, the category solves distribution. It takes a book of accounts, applies rules (geography, vertical, account size, sometimes named-account overrides), and produces territories that are supposed to be roughly equal in opportunity and workload. Sales operations teams use it to redraw boundaries after a reorg, split a region that’s grown too large, or rebalance after reps leave. Spreadsheets, CRM-native mapping tools, and purpose-built platforms all compete here, and the buying decision usually comes down to data quality, ease of use, and how defensible the split is when a rep asks why their territory looks the way it does. Purpose-built platforms are also the exception rather than the rule: HG Insights tracks Salesforce CRM installed at more than 473,000 companies worldwide, and fewer than 1 in 1,800 of them also run a dedicated territory-design platform such as Anaplan’s Territory and Quota Planning module or Xactly AlignStar. For most sales organizations, the CRM and a spreadsheet are the territory tool.
The blind spot: every account in a territory gets treated the same
Once a territory is drawn, most tools go quiet. The 200 accounts assigned to a rep sit in a flat list with no signal about which ten deserve attention this week. Nothing in the territory platform itself changes when a target account starts hiring for a role that signals a new initiative, lets a competitor’s contract lapse, or shows a spike in research activity around a category the rep sells into. The territory is still correct on paper. It’s just no longer a useful guide to where the rep should actually spend time.
Why static territories break down between planning cycles
Territory design in most enterprise RevOps organizations isn’t an annual planning exercise so much as a running repair job. A new division launches and needs whitespace mapped in weeks, not the next fiscal year. A rep leaves mid-quarter and their accounts need to move before the pipeline goes cold. An acquisition brings in a batch of accounts that don’t fit any existing territory logic. The map drawn in January is often out of date by March, and the team redrawing it is usually stitching together account data from a CRM, a spreadsheet, and two or three vendor sources that don’t agree with each other. The gap between the tools sales ops actually has and the tools built for this problem is wide: among the 24,270 enterprise companies (1,000-plus employees) HG Insights tracks running Salesforce CRM, just 0.8% also run a dedicated territory-design platform. The rest are managing the rebalance inside the CRM itself, or in a spreadsheet next to it.
That data reconciliation problem, matching the same company across a CRM, a firmographic provider, and an internal list, is often the real bottleneck behind a “quick” rebalance. Teams that treat it as a one-time data project rather than an ongoing discipline end up redrawing the same territories from scratch every cycle instead of adjusting a foundation that’s already trustworthy. That’s the opening that signal-based selling closes: not by replacing territory design, but by keeping the accounts inside each territory ranked against what’s actually happening in the market right now.
How signal-based selling turns territory design into an account-prioritization workflow
Signal-based selling means ranking accounts by real, observable buying indicators (technographic changes, intent spikes, hiring patterns, contract timing) instead of static firmographic fit alone. Applied inside a territory, it doesn’t change who owns an account. It changes the order a rep works their list in.
What counts as a buying signal inside a territory
Four signal types do most of the work: technographic data (what a company already runs, and whether a competitor’s install is aging out), intent data (a spike in research activity around a specific problem or category), firmographic movement (headcount growth in a relevant function, new funding, a leadership change), and contract or renewal timing (a competitor’s deal coming up for renewal). None of these signals are new to RevOps teams. What’s usually missing is a system that applies them consistently to every account already sitting inside a defined territory, rather than treating signal data and territory data as two separate projects run by two different teams.
From a flat territory list to a signal-ranked account list
Thomson Reuters built this exact bridge. Aroon Jham, who leads go-to-market analytics there, put it this way: “Knowing who to target and what to offer is challenging enough. But the hardest question for our sales teams is when to reach out. That’s where actionable intelligence becomes a game changer.” His team combined first-party CRM data with third-party signal intelligence to answer that timing question. “HG Insights provides time-series data that allows us to spot divergences in buyer behavior and competitive activity,” Jham said. “For instance, if buyers are increasingly mentioning our competitors over Thomson Reuters, that’s a signal for our sales team to act before we risk losing ground.” The territory didn’t change. The order in which reps worked it did, and that reordering is the entire value of layering signals on top of a territory plan.
Building the workflow: from territory data to a signal-ranked account list
Turning a static territory into a signal-ranked workflow is a sequence, not a single integration. Four steps cover most of it.
Start with one reconciled account universe
Before any signal gets layered on, the accounts inside a territory need to resolve to the same entity across every source feeding the process. A rep working from a CRM record, a spreadsheet import, and a vendor feed that all describe the same company slightly differently will trust none of them. Reconciling those records, so an account has one identity regardless of which system reported it, is unglamorous work, but it’s the step that makes every later signal trustworthy instead of noisy.
Layer buying signals onto every account in the territory
Once accounts resolve cleanly, the same technographic and intent signals get applied across the full territory, not just to a handful of flagged accounts. Storyblok took this approach when it needed to fix uneven territory planning ahead of a U.S. expansion. According to the Storyblok case study, the team built a propensity model scoring more than four million global accounts on firmographic and technographic fit, then layered intent data on top to assess both fit and purchase readiness at once, generating more pipeline in one quarter than the entire prior quarter and more than quadrupling average engagement within target accounts. “HG Insights has been a game-changer for Storyblok,” said Mark Wheeler, the company’s chief marketing officer. “By building a clear ICP and layering fit with intent data, we’ve aligned our entire go-to-market engine, from sales and BDRs to marketing and partners. We now operate with precision, clarity, and confidence. This is the backbone of our growth strategy.”
Score accounts so the ranking is explainable
A ranked list only earns trust if a rep or a sales manager can see why an account sits where it does. Scoring that shows its inputs (this account ranked highly because of a technographic change plus an intent spike, not a black-box number) holds up when a rep questions the list or a manager needs to defend a territory decision in a QBR. Explainable scoring is also what turns a one-time pilot into something a RevOps team keeps using after the first quarter.
Rebalance on a signal cadence, not a calendar cadence
The last step is frequency. A territory redrawn once a year and a signal-ranked list refreshed weekly or daily solve different problems, and both matter. The territory boundary should change when the business changes: a new market, an acquisition, a restructured region. The ranking inside that boundary should change constantly, because buying signals don’t wait for the next planning cycle.
What to look for in a platform that connects territory planning and account prioritization
Most RevOps teams evaluating this space are really choosing between two separate tools bolted together or one platform built to do both. A few criteria separate the two. Data reconciliation matters first: a platform that can’t resolve the same account across a CRM, a spreadsheet, and a vendor feed will produce a ranked list nobody trusts. Explainability matters next, since a scoring model with no visible reasoning gets ignored the first time a rep disagrees with it. Delivery matters too. Signals that live in a separate portal a rep has to remember to check get used far less than signals delivered inside the CRM or workflow tool the rep already opens every day.
HG Insights’ Platform was built around that last requirement specifically, combining technographic, intent, and firmographic data with the account and territory context a RevOps team already maintains, so the ranking shows up where reps actually work rather than in a dashboard they have to seek out. Teams working through the territory-design half of this problem can see how HG approaches balanced, data-driven coverage on the Territory Coverage & Optimization solution page. Teams further along, ready to layer signal data onto an existing territory structure, can see the account-ranking half on the Signal-Based Account Prioritization page. For teams that want to see both halves working together against their own account data, a short working session is usually faster than reading about it. HG Insights can walk through how territory data and buying signals combine into one prioritization workflow using accounts you already recognize.
Frequently Asked Questions
Can signal data improve sales territory planning?
Yes. Territory planning assigns accounts to reps based on firmographic and geographic rules, but it doesn’t account for which of those accounts are showing active buying intent right now. Layering signal data, technographic, intent, and firmographic movement, onto an existing territory reorders the account list inside each rep’s book without redrawing the territory itself.
How do you prioritize accounts within a territory or TAM?
Most RevOps teams start by scoring every account in the addressable market on firmographic fit, then layer technographic and intent signals on top to separate accounts that fit the ICP from accounts that fit the ICP and are actively in-market. The combination, fit plus readiness, is what produces a workable priority order instead of a flat list of qualified accounts.
How do reps prioritize accounts inside an ABM or named-account list?
Reps typically start with the accounts flagged for account-based marketing or a named list, then check which of those show recent buying signals: a technology change, a hiring pattern, or a spike in research activity. Reps looking for the broader tactics behind this kind of signal-driven prioritization can find more detail in HG Insights’ guide to signal-based selling tactics.
Can enriched data prioritize accounts better than firmographics alone?
Firmographic data answers whether an account fits the ideal customer profile. Enriched data, technographic details, intent signals, contract timing, answers whether that account is likely to buy soon. Prioritizing on firmographics alone tends to surface accounts that fit but aren’t ready. Adding enrichment surfaces the subset that fits and is in-market now.
Who owns account prioritization decisions, RevOps or sales leadership?
In most enterprise organizations, RevOps and sales operations build and maintain the prioritization model, since they own the underlying data and scoring logic. Sales leadership sets the strategic priorities the model should reflect, such as which verticals or competitive displacement targets matter most this year. The strongest setups involve both: RevOps builds the mechanism, sales leadership sets what it optimizes for.