
Market sizing data is only as useful as its shelf life, and for most enterprise strategy teams, that shelf life is shorter than they think. The Gartner subscription or Forrester report sitting in the shared drive was accurate the day it was published. By the time a board asks for an updated total addressable market number, a full quarter of IT spend has already moved somewhere the report never priced in. Market sizing data built on continuously refreshed spend signals, the approach HG Insights takes instead of an annual survey cycle, closes that gap and gives strategy leaders a number they can still defend next quarter.
Quick Answer: Market sizing data is accurate when it is grounded in actual spend and technographic signals rather than survey samples, and when it refreshes often enough to track real market movement. Static, annual analyst estimates go stale the moment budgets shift mid-year. Continuously refreshed spend data stays defensible because it reflects what companies are buying now, not what a panel guessed months ago.
The analyst estimate your team trusts, and why it’s already stale
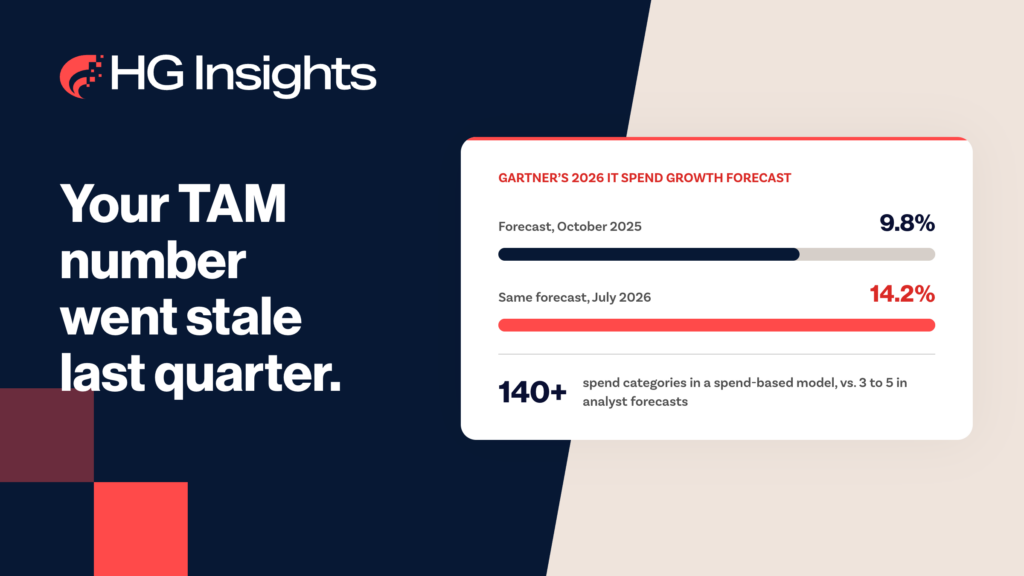
Most strategy teams do not start from zero. They start from a number: a Gartner IT Key Metrics figure, a Forrester Tech Market Forecast, or a McKinsey engagement commissioned for the last board cycle. That number carries real authority. It is also, structurally, out of date the moment it ships. Gartner revised its own 2026 global IT spending forecast four times in less than a year, from 9.8 percent growth in its October 2025 outlook to 14.2 percent growth by July 2026, a reasonable response to a fast-moving AI infrastructure buildout, but also proof that even the most trusted name in the category cannot hold a single number steady for a full year.
That gap shows up directly in enterprise sales conversations. In calls with strategy leaders over the past six months, one question recurs almost every time a competitive product comes up: how accurate is your spend data compared to an analyst report. It is not a rhetorical question. Teams that have already sat through a board meeting where the TAM number got challenged are looking for a defensible answer, not a bigger brand name. The honest answer starts with understanding why the analyst number drifted in the first place, and that starts with how it was built.
Why top-down, survey-based sizing breaks down in fast-moving categories
Analyst market research and most internal spreadsheet models share the same top-down logic: estimate a broad category total, then apply a penetration assumption to arrive at a company’s addressable slice. It works reasonably well for mature, slow-moving categories. It breaks down fast in categories where budget is actively reallocating, which in 2026 is most of enterprise software.
The survey lag problem
A survey-based estimate reflects what respondents said in the weeks before publication, filtered through analyst judgment, and released on a quarterly or annual cadence. In a category where a single new AI infrastructure line item can reshuffle a company’s software budget inside one fiscal quarter, a number that was accurate at the survey’s close can be materially wrong within two or three months. The lag is not a flaw in any one analyst’s methodology. It is a structural property of survey-based sizing.
The averaging problem
Top-down estimates also tend to average away the detail that actually matters for a GTM decision. Forrester’s Tech Market Forecast, for instance, groups spend into a handful of macro categories such as software, IT services, and communications equipment. That is useful for a board slide on total tech spend, but it cannot tell a strategy team whether cloud security spend or observability spend is the faster-growing pocket inside their addressable market. A model built on 140-plus granular spend categories can answer that question directly. A forecast built from a handful of macro buckets structurally cannot, no matter how rigorous the underlying research.
The blind spot is not hypothetical. Within HG Insights’ own product taxonomy, installed-product adoption for a single parent category called Security ranges from 17.8 percent for Cloud Security to 65.7 percent for Endpoint Security, measured across the same set of large U.S. enterprises. A single Security average would flatten that 48-point spread into one number that describes neither end of it.
What analyst reports get right, and where they stop
None of this is an argument that analyst research has no value. Gartner and Forrester earn their board-level trust honestly: decades of consistent methodology, large analyst teams, and a brand that a CFO will accept without a follow-up question. Forrester’s own Tech Market Forecast is a genuinely useful macro anchor. That granularity gap shows up in the numbers: a single enterprise account’s modeled IT spend profile pulled from HG Insights returns 135 distinct, individually dollarized spend categories, next to Forrester’s handful. It is also worth noting that Forrester relied on HG Insights as a 2019 data partner for exactly this kind of spend research, an early signal that the underlying data problem was already recognized as hard to solve internally.
Where analyst research stops is at the workflow boundary. A Gartner or Forrester deliverable arrives as a PDF or a spreadsheet. It has no account-level drilldown, no CRM connection, and no mechanism for a RevOps leader to turn a market number into a territory list without a separate manual project. Gartner’s decision to sell Capterra, Software Advice, and GetApp to G2 in February 2026 reads as a signal in the same direction: the firm is narrowing back toward core analyst research rather than expanding into GTM data and tooling. That leaves a real gap between the number a board will accept and the account list a sales team can actually work from.
How market sizing data from spend signals changes the equation
Spend-based market sizing data closes that gap by starting from a different input entirely: what companies are actually spending on, tracked continuously, rather than what a survey panel estimated they might spend. That shift changes four things about how the number gets built and what a team can do with it.
Forward-looking projections instead of backward-looking surveys
A spend-based model built on twelve-month forward IT spend projections tells a strategy team where a segment’s budget is heading, not just where it has already been. That distinction matters most in categories moving fastest, which is exactly where a stale analyst number does the most damage to a planning cycle.
Category granularity instead of industry buckets
Where Forrester works from a handful of macro categories and Gartner’s public quarterly figures are similarly broad, a taxonomy built around 140-plus spend categories lets a team ask a specific question, such as which companies are increasing security software spend this year, and get a specific answer. Granularity is what turns a market-size number into a segment prioritization decision.
Account-level drilldown from market view to target list
A market sizing exercise that stops at a dollar figure is only half finished. The more useful version connects that figure directly to the account list underneath it, so a RevOps leader can move from a segment-level TAM to a filtered list of named accounts in the same sitting, instead of commissioning a second project to translate strategy into territory design.
ICP validated against win-loss data, not assumptions
Most ideal customer profiles start as a hypothesis: a set of firmographic filters a team believes describes their best-fit buyer. Spend-based sizing lets that hypothesis get tested against actual win and loss patterns and technographic signals, rather than staying an assumption that nobody revisits until the next planning cycle exposes it as wrong.
Static snapshot vs. refreshable market sizing data: a side-by-side comparison
Dimension | Static analyst estimate | Refreshable spend-based model |
|---|---|---|
Refresh cadence | Annual or quarterly | Continuous |
Category granularity | 3 to 5 macro categories | 140-plus spend categories |
Account-level detail | None | Filtered, exportable account lists |
Methodology transparency | Published summary only | Coverage map and validation available on request |
Output format | PDF or spreadsheet | Interactive, drillable model |
The comparison is not a case for throwing out analyst research. It is a case for treating a static report as one input among several, and pairing it with a model that can be pulled forward the moment a market assumption needs to be checked mid-cycle, not held for the next annual refresh.
What actually makes market sizing accurate
Market sizing is accurate when two conditions hold at once: the underlying data reflects real transactions and technographic signals rather than self-reported survey intent, and the model refreshes on a cadence that matches how fast the category actually moves. A number built on stale survey data cannot be accurate no matter how sophisticated the modeling on top of it, and a number that refreshes constantly but still rests on hypothetical penetration assumptions is not accurate either. Both conditions have to hold together.
In practice, that means checking two things before trusting any market size figure a team is handed: where did the underlying data come from, and how old is it by the time a decision gets made on top of it. A number that fails either test deserves a second look before it drives a resourcing decision.
Putting spend-based market sizing data to work before your next planning cycle
For teams that want the calculation mechanics, HG Insights’ existing guides on calculating TAM, SAM, and SOM and building a data-driven growth strategy walk through the framework step by step. This article is not trying to re-teach that math. The point here is what feeds it.
HG Insights’ Market Analyzer builds market sizing data from the same forward-looking IT spend projections and 140-plus category taxonomy referenced throughout this piece, wrapped in a four-step guided workflow that moves from product description to a sized, account-drillable market view in hours rather than weeks. A strategy or RevOps leader can go from a market-level number to a filtered target account list in the same session, without a separate handoff project. See how HG Insights supports market sizing and segment prioritization for teams that want a defensible answer before the next board cycle, not after it.
The better next step, before assuming the current number is wrong or right, is a direct comparison: see how your current market estimate holds up against a spend-based model for the same segment. That comparison, not a generic demo, is what actually answers the question a board is going to ask anyway.
Frequently Asked Questions
What makes market sizing accurate?
Market sizing is most accurate when it is built on real spend and technographic signals, and when it refreshes on a cadence that matches how fast the category moves. A model that gets one of those right without the other will still drift out of date.
What is the difference between market sizing data and an analyst market research report?
An analyst market research report is a static snapshot built from survey samples and published on an annual or quarterly cycle. Market sizing data built from spend signals refreshes continuously and connects directly to an account-level list, rather than stopping at a single dollar figure in a PDF.
How often should market sizing data be refreshed?
Market sizing data should refresh on a cadence that matches how fast the underlying category moves. In fast-changing segments like AI infrastructure or security software, a number that is more than one quarter old has likely already drifted from actual budget allocation.
Does data-driven marketing inform market sizing?
Yes. Data-driven marketing signals, including technographic install data and intent activity, help validate whether a market sizing model’s assumptions match what accounts are actually doing, rather than relying solely on a top-down category estimate.
Why does market size matter for GTM planning?
Market size determines where a company points its limited GTM resources. A market size number built on stale or overly broad category data leads teams to prioritize the wrong segments, misallocating budget and sales capacity toward accounts with less real opportunity than the estimate suggested.
What is the difference between top-down and bottom-up market sizing?
Top-down market sizing starts from a broad category total and applies a penetration assumption downward. Bottom-up market sizing starts from actual company-level data, such as spend or install counts, and builds the total up from real accounts, which is generally the more defensible and auditable approach.