
TAM is one of the most frequently cited numbers in B2B strategy, and one of the most frequently wrong. It shows up in board presentations, investor decks, territory plans, and product roadmap justifications. It shapes how organizations allocate capital, hire sellers, and decide which markets to enter or exit. And yet, for a number that carries that much weight, the way most teams calculate it hasn’t kept pace with the data now available to make it accurate.
If your TAM is built on a top-down industry estimate from an analyst report that was published 18 months ago, you’re making high-stakes decisions on a number that may bear little resemblance to your actual addressable opportunity. If it’s based on a back-of-the-napkin formula that multiplies average deal size by a rough account count, it’s a starting point at best. Neither approach accounts for the technology environments, spending patterns, and buying behaviors that determine which accounts can actually become your customers. This is the gap that account-level intelligence platforms like HG Insights are built to close, combining technographic data, spend signals, and install-base intelligence to surface what analyst reports can’t tell you.
This guide breaks down what TAM is, how to calculate it using methods that range from foundational to advanced, and how modern market intelligence is making it possible to build TAM models that your GTM strategy can actually rely on.
What is Total Addressable Market (TAM)?
Total Addressable Market, commonly referred to as TAM, represents the total revenue opportunity available to your product or service if you achieved 100% market share within your defined market. It’s the theoretical ceiling of demand for what you sell.
TAM serves several strategic functions. It informs go-to-market strategy by defining the size and shape of the opportunity your team is pursuing. It supports investment planning by helping leadership evaluate whether a market is large enough to justify the resources required to compete in it. And it provides the foundation for resource prioritization, guiding decisions about where to deploy sellers, allocate marketing budget, and focus product development.
What TAM does not tell you is how much of that market you can realistically capture. That distinction is where SAM and SOM come in, and understanding the relationship between all three is what turns TAM from a headline number into a planning tool.
TAM vs. SAM vs. SOM: how the three levels of market sizing work together
TAM, SAM, and SOM are often presented together because each one answers a different strategic question about the same market opportunity.
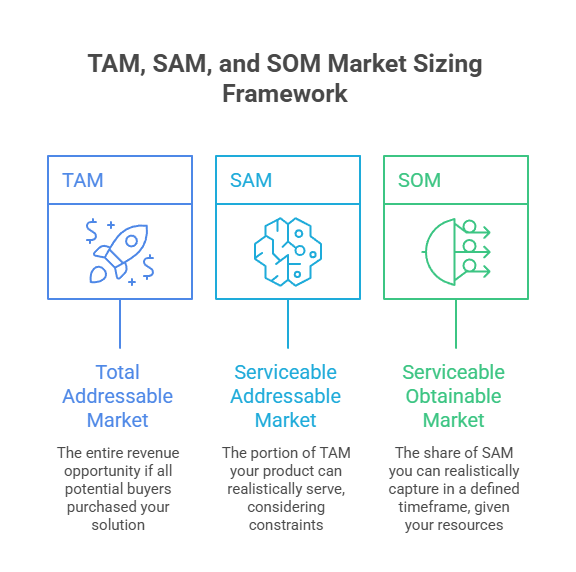
TAM (Total Addressable Market) is the total revenue opportunity if every potential buyer in the market purchased your solution. It defines the full scope of demand without filtering for your specific capabilities, geographic reach, or competitive position.
SAM (Serviceable Addressable Market) narrows TAM to the portion your product can actually serve. This accounts for constraints like geographic coverage, product capability fit, regulatory limitations, and the segments where your solution delivers genuine value. SAM answers the question: of the total market, how much of it can we realistically compete for?
SOM (Serviceable Obtainable Market) narrows further to the share of SAM you can realistically capture in a defined timeframe, given your current resources, competitive position, brand awareness, and sales capacity. SOM is the number your revenue targets should be grounded in.
These three levels work together to create a market sizing framework that moves from theoretical potential (TAM) to strategic focus (SAM) to operational planning (SOM). Teams that skip SAM and SOM and plan against TAM alone consistently overestimate their near-term opportunity and under allocate resources to the segments where they can actually win.
For a deeper look at how these three levels inform market segmentation and TAM planning, the relationship between them becomes even more valuable when enriched with real account-level data.
How to calculate TAM: three approaches with different strengths
There is no single correct way to calculate TAM. The right method depends on your data maturity, the precision your decisions require, and the resources you have available. Three approaches are most common, each with distinct advantages and limitations.
Three ways to calculate TAM, compared
| Method | Where the number starts | Worked example from this guide | Primary strength | Where it falls short |
|---|---|---|---|---|
| Top-down | A broad market estimate from analyst or industry research, narrowed by segment | $180B cybersecurity market at 8% applicability = roughly $14.4B TAM | Speed, with minimal proprietary data required | Tends to overestimate because it does not filter for ICP fit, tech compatibility, or budget readiness |
| Bottom-up | Your own deal data, multiplied across ICP-matched accounts | $85,000 average ACV across 12,000 ICP-matched accounts = roughly $1.02B TAM | Accuracy, because it reflects your real sales motion | Only as good as your ICP definition and account data completeness |
| Hybrid | Top-down framing plus bottom-up math, then enriched with external signals | Combines both methods with firmographic, technographic, install-base, and spend data | Defensible in a board deck and actionable in a territory plan | Requires access to enriched external intelligence to build |
Top-down TAM calculation starts with the big picture and works inward
A top-down approach begins with a broad market size estimate, usually sourced from analyst reports, industry research, or public data, and then narrows it based on your product’s applicability and target segments.
For example, if an analyst report estimates the global cybersecurity market at $180 billion, and your product addresses endpoint protection for mid-market enterprises, you might estimate that your addressable segment represents 8% of that total, producing a TAM estimate of roughly $14.4 billion.
The advantage of top-down is speed. It gives you a directional number quickly and requires minimal proprietary data. The limitation is precision. Analyst estimates are often dated, broadly defined, and disconnected from the account-level reality of who can actually buy your product. Top-down TAM tends to overestimate opportunity because it doesn’t filter for ICP fit, technology compatibility, or budget readiness.
Top-down is useful for early-stage framing, investor conversations, and high-level strategic discussions. It becomes risky when it’s used as the primary input for territory design, quota setting, or resource allocation, decisions that require more granular accuracy.
Bottom-up TAM calculation builds from your actual customer data
A bottom-up approach starts with your own business data and works outward. The basic formula multiplies your average deal size (or annual contract value) by the total number of accounts that match your ICP criteria.
For example, if your average ACV is $85,000 and you’ve identified 12,000 accounts that match your firmographic and technographic ICP, your bottom-up TAM would be approximately $1.02 billion.
The advantage of bottom-up is accuracy. Because it’s grounded in real deal data and real account counts, it produces a TAM estimate that reflects your product’s actual market rather than an analyst’s broad categorization. The limitation is that it depends heavily on the quality and completeness of your ICP definition and your account data. If your ICP is too narrow, you’ll undercount. If your account data is incomplete, you’ll miss segments entirely.
Bottom-up is the preferred method for GTM planning, territory design, and operational resource allocation because it produces numbers that connect directly to your sales motion.
Hybrid models combine both approaches with advanced data signals
A hybrid approach blends the breadth of top-down framing with the precision of bottom-up calculation, and then enriches the result with additional data signals like firmographics, technographics, install-base intelligence, and spend patterns.
This is where TAM modeling becomes most powerful. Instead of relying solely on analyst estimates or your own historical deal data, a hybrid model incorporates external intelligence that reveals which accounts within your addressable market are running compatible technologies, allocating budget in your category, and showing behavioral signals that indicate readiness.
Technology-based TAM modeling allows you to move beyond static account counts and build a TAM that reflects the actual technology and financial characteristics of your addressable market. The result is a model that’s both defensible in a board presentation and actionable in a territory plan.
Real-world TAM examples for B2B and SaaS markets
TAM calculations become more intuitive when applied to specific scenarios. Two examples illustrate how different B2B companies approach the exercise.
SaaS productivity platform: A company selling a collaboration tool for distributed engineering teams might start with a broad TAM based on the total number of companies with more than 200 employees that have engineering functions. But that top-line number doesn’t reflect reality.
By layering install-base data to identify companies already running complementary development tools, and cloud adoption rates to filter for organizations with the infrastructure to support the product, the team can refine their TAM to a much more accurate and actionable number. The result is a TAM that reflects not just who could use the product in theory, but who is operating in a technology environment where it would add immediate value.
Cybersecurity vendor: A company offering compliance automation for regulated industries might define their initial TAM as all companies subject to specific regulatory frameworks. But regulatory scope alone doesn’t determine buying readiness.
By adding technographic data to identify organizations running legacy compliance tools approaching end-of-life, and spend intelligence to surface accounts increasing their security budgets, the TAM estimate shifts from a broad compliance-based count to a prioritized view of accounts with both regulatory need and financial commitment.
GTM teams that apply this approach report cleaner alignment between sales and marketing and more focused targeting of high-potential accounts. HiBob, for example, adopted HG Insights to refine their TAM analysis using technographics and was able to expand into new geographies with accurate market sizing while reducing wasted spend on low-fit accounts.
How technographics, intent, and spend data make TAM models more accurate
Traditional TAM models rely on firmographic inputs: industry, company size, revenue, geography. These attributes define the general shape of your market, but they don’t reveal which accounts within that market are actually in a position to buy.
Three categories of intelligence close that gap.
Technographic data surfaces the technology environment inside each account. It shows what products and platforms a company has deployed, where their technology stack aligns with or complements your solution, and where gaps or aging infrastructure suggest an upcoming purchase cycle. When technographics are applied to TAM modeling, the result is a market size estimate that reflects product compatibility rather than just firmographic similarity.
Buyer intent data reveals which accounts are actively researching topics, solutions, or vendors related to your category. Intent signals don’t change the size of your TAM, but they add a timing dimension that makes it actionable. Knowing which accounts within your addressable market are currently in a research or evaluation phase allows your team to prioritize outreach and allocate resources toward the portion of your TAM that’s most likely to convert in the near term.
Technology spend data adds a financial validation layer. Spend intelligence shows where organizations are increasing, maintaining, or reducing budget allocation in your technology category. An account that matches your ICP firmographically and technographically but is reducing spend in your category represents a different opportunity than one that’s actively increasing investment.
When all three of these signals are combined with firmographic data in a unified market and account intelligence platform, your TAM model evolves from a static estimate into a dynamic, prioritized view of your real addressable opportunity.
How GTM teams use TAM operationally
A well-built TAM model doesn’t just answer “how big is our market?” It becomes an operational input that shapes how your GTM team plans and executes.
Market prioritization and expansion planning. TAM analysis by segment, vertical, and geography reveals where the largest concentrations of addressable opportunity exist. This helps leadership decide where to invest next, whether that’s entering a new vertical, expanding into a new region, or deepening penetration in an existing segment.
Territory design. When TAM is calculated at the segment and account level, territory assignments can reflect actual opportunity distribution rather than simple geographic or account-count divisions. Reps get territories sized by addressable revenue potential, which produces more equitable quota distribution and more realistic performance expectations.
Campaign targeting. Marketing teams use TAM and SAM analysis to define the audience for campaigns, ensuring budget is directed toward segments where the addressable opportunity is large enough to justify the investment. When TAM is enriched with intent and spend signals, campaign targeting becomes even more precise because it reflects not just where the opportunity exists, but where it’s active.
Investor and board communications. For companies raising capital or reporting to a board, a well-sourced TAM model built on verifiable data carries significantly more credibility than a top-down estimate from a single analyst report. Bottom-up and hybrid TAM models that reference specific account counts, technology signals, and spend patterns demonstrate rigor that investors and board members respond to.
Accurate TAM starts with better intelligence underneath it
The quality of your TAM model is determined by the quality of the data that goes into it. When inputs are outdated, incomplete, or disconnected from account-level reality, the TAM estimate that comes out will misguide the GTM decisions built on top of it. Territory plans, quota models, campaign budgets, and hiring plans all inherit the accuracy or inaccuracy of the number they’re built on.
HG Insights provides dynamic, intent-informed, and install-based data models that support confident market sizing. By combining technographic intelligence, buyer intent signals, and technology spend data into a single platform, HG Insights gives GTM teams the inputs they need to build TAM models that reflect real market conditions rather than broad assumptions.
Build your TAM on intelligence your GTM strategy can trust. See how HG Insights brings precision to market sizing.