
Most B2B teams run an account scoring model already, but few can say with confidence which inputs in that model are actually earning their keep. Firmographic fit, technographic signals, buyer intent, and behavioral engagement all get scored, yet they do not predict conversion equally well, and some barely predict it at all. This piece looks at what the data actually shows: which signals correlate with closed-won, which ones mostly just look predictive, and how enterprise and growth teams should weight them differently.
What “predicts conversion” actually means in account scoring
Account scoring only earns its keep if it separates the accounts that will actually close from the ones that just look active. That is a narrower claim than most teams treat it as. A high score should mean a measurably higher chance of conversion, not just a busier account or a better-looking logo. Forrester’s 2026 State of Business Buying report, based on nearly 18,000 global buyer responses, found that a typical enterprise purchase now involves 13 internal stakeholders and nine external influencers. Scoring a single contact against that backdrop tells you almost nothing about whether the account is ready to buy.
That is the real dividing line between lead scoring and account scoring. Lead scoring ranks a person’s engagement. Account scoring aggregates fit, intent, and behavior across the whole buying group to rank the account itself. The rest of this piece treats “predicts conversion” literally: which signal categories, alone and combined, actually correlate with an account moving to closed-won, and which ones mostly just feel predictive.
The data and methodology behind this benchmark
This benchmark draws on two layers of evidence rather than a single controlled study, and each layer supports a different kind of claim.
The scoring framework behind the benchmark
The first layer is HG Insights’ own scoring framework, which scores every account on two independent 0-100 models once it reaches a CRM: a Customer Fit score built from firmographic and technographic data, and a Likelihood to Buy score built from behavioral engagement. Both are segmented into four tiers (Low, Medium, Good or High, and Very Good or Very High), and both are designed to be transparent: every score ships with the specific signals that drove it, not a black-box number. (HG scores net-new accounts before they ever reach a CRM through a separate model; see Inside HG Insights’ Account Prioritization Methodology for that full mechanic.)
How HG’s own customers actually use these signals
The second layer is a review of how HG’s own enterprise and growth customers actually use those signals to prioritize accounts, drawn from a broad sample of enterprise and growth-segment customer conversations gathered over a 180-day window. That is a pattern analysis of deployed scoring behavior, not a randomized trial, so treat the findings below as directional benchmarks grounded in real usage rather than a precise coefficient. For the model-building mechanics behind these signal categories, the Definitive Guide to Account Scoring walks through how to construct the scoring logic itself. This piece focuses on which inputs to that logic actually earn their weight.
The scale difference between segments
Scale matters here too. HG Insights’ own install-base data puts roughly 517,000 U.S. companies in the $10 million to $100 million revenue band that defines the growth segment, against about 3,200 U.S. companies at $1 billion or more in revenue, a ratio of roughly 162 growth-segment accounts for every enterprise account. That density difference is a big part of why enterprise and growth scoring models can’t share the same weighting logic. One segment is scoring a comparatively small, data-rich population, and the other is scoring a huge, uneven one.
Firmographic fit vs. technographic signals: which correlates more with conversion
Firmographic and technographic signals do not compete with each other in practice. They compound. An account with more than $10 million in annual IT spend that has run a competitor’s product for four or more years is a fundamentally different opportunity than one that merely matches an industry and headcount filter. The first is a Customer Fit signal set that predicts who is worth pursuing. It says nothing about when.
That combination is also where the data on deal size lines up cleanest. Landbase’s 2026 guide to account scoring found that B2B teams selling above $10,000 in annual contract value should treat account-level fit, not individual lead behavior, as the primary prioritization signal. Firmographic data (industry, revenue, geography, headcount) sets the addressable boundary. Technographic data (competitive and complementary product presence, install age, cloud maturity, vendor penetration) tells you whether that boundary is a live opportunity or a theoretical one. Enterprise accounts in HG’s own base consistently treat the two as a single fit signal rather than scoring them separately, and that is the pattern worth copying: firmographic fit without technographic context tends to overstate how many accounts are actually reachable.
Where buyer intent data over- and under-performs as a predictor
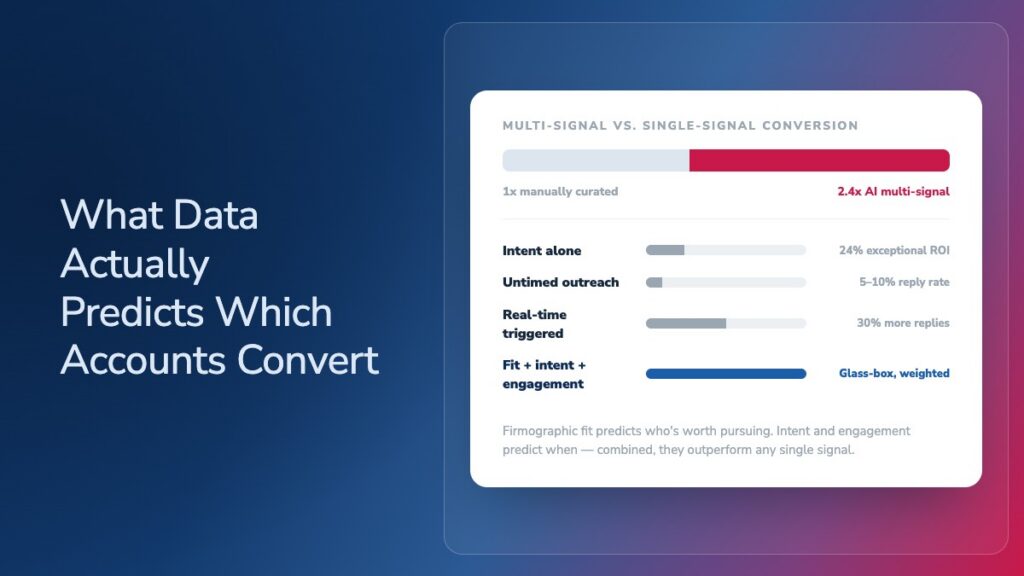
Used alone, intent data is a weaker predictor than most GTM stacks assume. MarketBetter’s 2026 intent data guide found that only 24% of B2B teams report exceptional ROI from intent data despite 91% adoption, a gap that shows up as topic surges and page visits that never translate into pipeline. Intent signals measure interest, and interest is cheap. A competitor’s blog post can spike a dozen accounts’ intent scores in a single afternoon without moving a single one closer to a purchase decision.
Intent data earns its place when it is layered on top of fit rather than scored on its own. HG’s enterprise accounts that combine technographic fit with third-party intent, rather than treating intent as a standalone qualifier, report a materially different experience with the same data: intent becomes a timing signal on top of an already-qualified account list, not a replacement for qualification. That distinction, intent as a multiplier on fit rather than a substitute for it, is the difference between the 24% of teams seeing exceptional ROI and the 76% who are not.
Do engagement signals actually move conversion, or just feel like they should
Behavioral engagement, in-app usage, website visits, campaign clicks, predicts timing far better than it predicts fit, and treating it as a fit signal is where most scoring models quietly break. HG’s Likelihood to Buy score is recomputed multiple times a day for exactly this reason: a static engagement score measured once a month tells you almost nothing about whether an account is in-market right now.
The cost of getting this wrong shows up at the threshold. In HG’s growth-segment research, leads scoring in the 70 to 74 range, just under a typical 75-point qualification bar, received only automated outreach and no direct sales attention, even though a static ten-point margin is not a meaningful gap in buyer readiness. Warmly’s 2026 research on trigger-based outreach makes the stakes concrete: clients running personalized outreach triggered within minutes of a real-time signal, like a pricing-page visit, see 3 times higher click rates and 30% more replies than generic, untimed sequences. Engagement signals are a timing predictor, not a fit predictor, and a scoring model that lets them decay slowly, on a 30- or 90-day window instead of something closer to real time, is measuring last month’s interest and calling it today’s readiness.
The multi-signal effect: what happens when signals are combined
No single signal category comes close to what the combination produces. An aggregated 2026 analysis of intent-platform provider data, cited in MarketBetter’s meta-analysis of more than 20 B2B AI sales studies, found that AI-scored, multi-signal account lists converted to pipeline at 2.4 times the rate of manually curated lists. GrowthSpree’s 2026 research on scoring-fed ad targeting found a similarly sized effect from a different angle: feeding fit scores into ad algorithms instead of raw form fills cut cost per SQL by 30% to 50% and lifted MQL-to-SQL rates from roughly 13% to 25-35%.
HG Insights’ own Lead Grade model is built around this compounding effect rather than around any single input. An account with a Very Good Customer Fit score and a Very High Likelihood to Buy score earns the top Lead Grade, and that combination is what the account example earlier in this piece, $10 million-plus IT spend, a multi-year competitor install, and recent pricing-page visits, actually adds up to. The gap HG’s own enterprise research surfaces is not conceptual. Most accounts understand that fit plus intent plus engagement should outperform any one signal. Most are still operationalizing only one or two of the three. The 2.4x conversion lift is sitting on the table for any team that closes that gap.
Benchmark results by segment: enterprise vs. growth conversion patterns
Enterprise and growth accounts predict conversion differently, and the difference is not sophistication, it is which part of the funnel each segment is optimizing.
Enterprise: co-developed, multi-signal models
HG’s enterprise research shows accounts building custom, co-developed scoring models that blend firmographic fit, technographic depth, and behavioral timing from day one, with score transparency as the single most-cited reason reps trust and act on the output. That pattern tracks with Deloitte’s February 2026 finding that digitally mature B2B suppliers grew 110% faster than less mature peers, and that companies with completed ERP integrations were four times as likely to run highly automated sales processes.
Growth: thinner fit data, higher underutilization risk
Growth accounts predict conversion through a different lens entirely, largely because the underlying fit data is thinner. HG Insights install data shows 91.4% of U.S. companies with $1 billion or more in revenue run a dedicated CRM application, versus 34.8% of companies in the $10 million to $100 million range, so a meaningful share of growth-segment accounts simply don’t have a scoreable CRM record yet. That is part of why growth accounts enter through lead scoring, not account scoring, and why the biggest threat to realizing predictive value is not a missing signal, it is underutilization: scoring data that sits unused because no one owns the Salesforce field mapping or the monthly model refresh. Glass-box transparency still matters to growth buyers, but it is a secondary selling point behind speed-to-value. The practical read for both segments: enterprise teams should worry about operationalizing the multi-signal models they are already building, and growth teams should worry less about model sophistication and more about whether anyone is actually acting on the score once it lands in the CRM.
The segment cuts above are the summary version. Marketing Ops and RevOps teams that want the full breakdown, benchmark figures sliced by segment, deal size, and signal combination, can request the expanded benchmark data set directly from HG Insights.
What this means for how you weight your own scoring model
The weighting question is really two separate questions wearing one label. Fit signals, firmographic and technographic combined, answer “is this the right account,” and they should carry most of the weight in deciding whether an account enters a program at all. Intent and engagement signals answer “is now the right time,” and they should carry the weight in deciding sequencing and outreach timing, not inclusion. Collapsing those two questions into a single blended score is the most common reason scoring models underperform their inputs.
Transparency in how those weights are set matters as much as the weights themselves. The EU AI Act’s transparency provisions took effect in August 2026, part of a broader regulatory push toward AI explainability that is turning glass-box scoring from a competitive preference into a compliance-relevant practice in the markets it covers. HG Insights builds every scoring profile with weights that are visible, adjustable, and normalized to sum to 100, specifically so a rep or a RevOps lead can see why an account scored the way it did rather than trusting a number. Teams building or refreshing a model this quarter can talk through applying these signal weightings to their own stack directly with HG’s data science team.
Frequently Asked Questions
What is account scoring?
Account scoring is the practice of ranking B2B accounts, rather than individual leads, by combining firmographic fit, technographic signals, buyer intent, and behavioral engagement into a single score that predicts how likely an account is to convert and how much value it could generate.
What is the difference between account scoring and lead scoring?
Lead scoring ranks an individual contact’s engagement. Account scoring aggregates signals across an entire buying group, typically 13 or more stakeholders in an enterprise deal, to rank the account as a whole, which better reflects how B2B purchases actually get decided.
What data actually predicts which accounts convert?
No single data type reliably predicts conversion on its own. Firmographic and technographic fit predict which accounts are worth pursuing, engagement signals predict timing, and combining all three into one model outperforms any single signal by a wide margin in benchmark research.
Does buyer intent data alone predict conversion?
Not reliably. Only 24% of B2B teams report exceptional ROI from intent data despite 91% adoption, because intent measures interest, not fit. Intent data becomes predictive when it is layered on top of firmographic and technographic qualification rather than scored on its own.
What is account prioritization used for?
Account prioritization uses a combined score, fit plus intent plus engagement, to decide which accounts sales and marketing should focus resources on first, replacing manual, spreadsheet-based ranking with a transparent, signal-backed model that updates as new data arrives.
How should I weight firmographic, technographic, intent, and engagement signals in a scoring model?
Firmographic and technographic fit should carry the most weight in deciding whether an account qualifies at all, since they answer whether it is the right target. Intent and engagement signals should weight timing and outreach sequencing, since they answer when to act, not whether to.