

Most B2B teams have an ICP documented somewhere. Fewer have translated it into consistent targeting that sales and marketing actually execute against in the same way. That gap between a defined profile and an operational segmentation framework is where campaigns lose focus, territories get drawn without regard for real opportunity, and account lists drift from the criteria that were supposed to define them.
Firmographic segmentation provides the structure to close that gap. It organizes your addressable market into clearly defined, prioritized account groups based on the company-level attributes that predict fit, and it gives every GTM function a shared foundation for deciding where to invest effort.
This guide breaks down how to apply firmographic segmentation across market sizing, account prioritization, ABM, territory planning, and competitive displacement, along with how to strengthen it by layering additional intelligence on top.
In This Guide:
- What firmographic segmentation means for B2B teams
- Why firmographic data alone isn’t enough
- How to build your ICP around firmographic attributes
- Applying firmographic segmentation to market sizing, whitespace analysis, account scoring, territory design, ABM, and competitive displacement
- Common mistakes to avoid
- How HG Insights powers smarter firmographic segmentation
What firmographic segmentation means for B2B teams
Firmographic segmentation groups companies according to core business characteristics: market category, industry, geography, revenue, employee count, ownership model, growth stage, and overall company size. These attributes help GTM teams identify patterns in which accounts are most likely to align with their offering.
In B2B, firmographic segmentation functions like demographic segmentation does in B2C, but the unit of analysis is the company rather than the individual. It answers a foundational question at the start of any B2B segmentation strategy: which companies structurally look like the right market for you?
What makes firmographic data particularly valuable as a segmentation foundation is its stability. Behavioral signals can shift quickly based on campaign activity or short-term interest. Firmographic attributes change more slowly, which gives your team a reliable baseline for segmentation decisions that need to hold up over quarters, not just weeks.
Firmographic data defines fit but doesn’t tell you who’s ready to buy
Firmographics answer the question of which companies look like the right market. They don’t answer which of those companies are actively researching solutions, what tools they currently rely on, or how much they’re prepared to spend.
Two different companies with the same firmographic profiles can be in completely different buying positions. One may be actively evaluating solutions in your category with a growing technology budget. The other may be locked into a competitor’s platform with no intention of switching. However, firmographic data treats them identically because it can’t see the distinction.
Teams that combine technographic insights, IT spend data, and intent signals with firmographic attributes build segments that are far more actionable. Firmographics define the shape of your market. Technographics, spend, and intent reveal which parts of that market are ready to engage right now, which is why 95% of Fortune 1000 B2B tech companies and all major hyper-scalers rely on HG Insights to layer this intelligence on top of their firmographic foundation.
What each data layer reveals about an account
| Data layer | Core question it answers | Example attributes | What it cannot tell you on its own |
|---|---|---|---|
| Firmographic | Does this company structurally look like our market? | Industry, revenue band, employee count, geography, growth stage, ownership model | Whether the account is in-market now or able to fund a purchase |
| Technographic | What does this company already run, and does our solution fit that environment? | Installed products, competitor platforms in use, stack maturity | Budget capacity or active buying interest |
| IT spend | Can this company fund a purchase, and at what scale? | Projected spend by category, budget trends, investment direction | Whether an evaluation is happening right now |
| Buyer intent | Is this company actively researching solutions in our category? | Topic surges, content consumption, in-market activity | Long-term structural fit |
For a deeper look at how these layers work together, the GTM strategist’s guide to segmentation in 2026 covers how modern teams are building multidimensional segmentation models.
Your ICP should be built on patterns tied to commercial outcomes, not just company descriptions
A strong ICP starts by analyzing the shared attributes of your best customers. But “best” needs to be defined by commercial outcomes, not just logo recognition or account size. The most useful inputs are patterns tied to highest ACV, fastest sales cycles, strongest retention, greatest expansion revenue, and highest win rates.
These patterns often reveal ICP criteria that demographic intuition wouldn’t surface. You may find that your fastest-closing deals come from a specific revenue band in a specific industry with a specific growth stage, and that combination is more predictive than any single firmographic attribute alone.
Validation turns a general profile into a decision-making framework. Comparing your ICP attributes against actual win rates and deal velocity data exposes which criteria genuinely predict conversion and which ones are noise. That validated framework can then guide account segmentation across sales, marketing, and RevOps systems with confidence that it reflects how your market actually buys.
Firmographic filters make market sizing practical rather than aspirational
Market sizing becomes significantly more accurate when firmographic filters are applied early. Instead of relying on broad analyst estimates that count every company in a category, your team can calculate how many accounts actually match your ICP criteria across the dimensions that matter: industry, revenue band, geography, company size, and growth stage.
The practical benefit is that investment decisions get grounded in realistic account potential rather than oversized totals that exaggerate the true addressable market. A TAM estimate that says your market is $5 billion is less useful than one that shows 8,200 accounts matching your firmographic ICP with an average ACV of $95,000, because the second number connects directly to territory planning, quota setting, and campaign budgeting.
When firmographic segmentation is combined with technographic and spend filters, market sizing moves from a planning exercise to an operational input that every GTM function can build against. HG Insights’ IT spend taxonomy spans more than 140 technology categories, giving teams the filtering precision to calculate a realistic addressable market rather than relying on broad analyst estimates.
Whitespace analysis becomes actionable when firmographic segmentation defines where to look
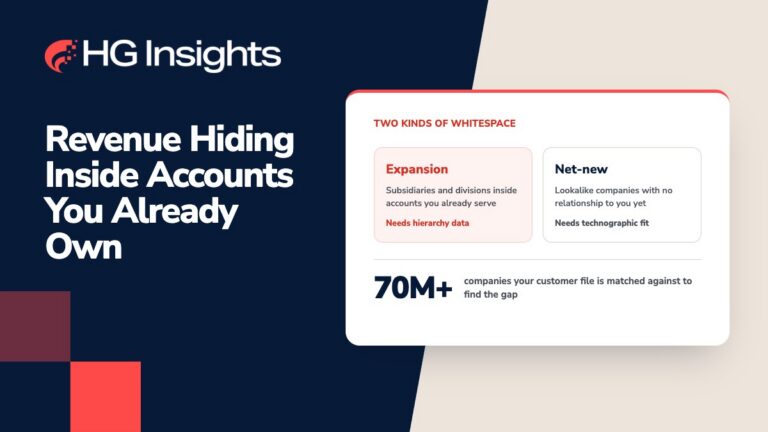
Firmographic segmentation helps identify which parts of the market are already well-covered and which remain open for expansion. Without that structure, whitespace analysis tends to produce a broad map of “opportunity everywhere” that’s difficult to translate into specific account lists or territory adjustments.
With firmographic segmentation applied, whitespace analysis gets practical. You can spot strong-fit accounts that meet your ICP criteria but have little current engagement or no visible pipeline activity. These are accounts that your team hasn’t reached yet, and firmographic alignment suggests they’re worth reaching.
The value increases when whitespace is mapped within existing segments rather than across the entire market. A whitespace pocket inside a segment where you already have strong win rates and competitive positioning is a higher-confidence expansion opportunity than one in a segment you’ve never successfully sold into.
Account scoring improves when firmographic fit balances behavioral signals
Scoring models that weight behavioral signals heavily tend to surface accounts that are most active rather than most valuable. A low-fit account that downloaded three whitepapers may outscore a high-fit account that hasn’t visited your website yet, even though the second account represents a stronger conversion opportunity.
Weighting firmographic attributes like industry alignment, revenue band, and company size creates the balance that behavioral signals alone can’t provide. A high-fit account with low current activity may deserve attention precisely because the firmographic alignment suggests the opportunity is real even if the timing hasn’t arrived yet.
The strongest scoring models treat firmographic fit as the foundation and layer of behavioral, technographic, and intent signals on top to determine priority and timing. That combination produces scores your reps will trust because the model reflects what they see in their own deal experience.
Territory models should reflect firmographic density, not just geographic boundaries
Territory design based on regional boundaries frequently creates imbalanced workloads. One rep may inherit a geography dense with high-fit accounts while another receives a region where qualified accounts are sparse. Both territories look equivalent on a map but produce very different pipeline outcomes.
Firmographic segmentation helps sales leaders shape territories around where qualified accounts actually concentrate. When territory assignments reflect firmographic density, spend capacity, and account fit rather than just geography or account count, every rep’s book of business has a credible path to quota.
A potential-based territory model also makes it easier to identify coverage gaps. If a territory contains a high concentration of ICP-matching accounts that aren’t being worked, the data surfaces that gap before it becomes a missed quarter.
ABM account selection gets sharper when firmographic criteria narrow the universe first
ABM programs benefit from starting with firmographic segmentation because it narrows the account universe to companies that structurally align with your ICP before any subjective selection happens. This prevents the common problem of ABM lists that include accounts based on logo recognition or sales rep preference rather than verified fit criteria.
Firmographic criteria alone produce a list that’s directionally right but lacks the precision ABM demands. Combining firmographic filters with intent signals and technographic context produces target account lists where every account has been validated for structural fit, technology environment alignment, and current buying behavior.
That multi-layer selection process produces ABM lists that convert at higher rates because every account on the list earned its place through data rather than assumption.
Competitive displacement starts with firmographic overlap and gets sharper with install data
Firmographic segmentation highlights accounts that resemble your best customers, which makes them strong candidates for competitive displacement strategies. If an account matches the firmographic profile of companies where you’ve historically won, the structural fit suggests your solution would perform well in that environment.
When technographic data is layered on top, the picture becomes actionable. You can see which of those firmographically aligned accounts are currently running a competitor’s product, turning a broad “looks like our customer” signal into a specific “uses our competitor and matches our ICP” target.
Outreach becomes easier to prioritize and messaging becomes more relevant because your team can reference the specific competitive context of each account rather than leading with generic positioning.
Two firmographic segmentation mistakes consistently limit results
Using a single attribute as the basis for segmentation. Segmenting by industry alone or company size alone creates groups that are too broad to support meaningful targeting. A segment defined as “mid-market SaaS companies” includes organizations with vastly different technology environments, spending patterns, and buying behaviors. Effective segmentation blends multiple firmographic dimensions to reflect real buying patterns rather than treating any single attribute as sufficient.
Treating segments as static. Company attributes change over time. Revenue grows. Headcount shifts. Companies get acquired, restructure, or change industries. Segmentation models that aren’t refreshed regularly drift from current market conditions, which means your targeting, scoring, and territory models are all working against an outdated picture of the market. Building a refresh cadence into your segmentation process ensures your GTM execution reflects the market as it exists today.
HG Insights powers smarter firmographic segmentation with deeper intelligence layers
Firmographic segmentation delivers stronger results when paired with the additional intelligence that reveals which structurally aligned accounts are actually worth pursuing right now. HG Insights brings together firmographic data, technographic insights, IT spend intelligence, and buyer intent signals into a unified Revenue Growth Intelligence platform.
That combination gives your team a segmentation foundation that goes beyond structural fit to include technology environment, financial capacity, and current buying behavior. From market sizing and whitespace analysis to account scoring, territory design, ABM targeting, and competitive displacement, HG Insights provides the enriched data layer that makes every firmographic segment actionable.
Turn firmographic segmentation into a GTM strategy your revenue team can execute against. Learn how to build a SaaS go-to-market plan with real-world examples.