

Your ABM target account list can look strong in a spreadsheet and still drain pipeline quality before sales ever makes contact. Revenue, employee count, and industry often point your team toward companies that seem attractive at first glance, yet sales teams regularly discover that many of those accounts never progress past the first conversation.
Technographic data closes that gap. It reveals how an account actually operates behind the company profile, including the technology investments they’ve made, the platforms they rely on, and the signals tied to buying readiness. Your team can use those insights to refine account selection, prioritize outreach, and validate where time and budget are best spent.
This guide walks through how to turn a static ABM target account list into a sharper account selection engine powered by tech stack signals, spend context, and buyer intent. The goal isn’t to build the largest list. It’s to identify high-fit ABM accounts that your sales and marketing teams can act on with confidence.
In This Guide:
- Why firmographics alone produce weak ABM lists
- What technographic data actually reveals about account fit
- How to map your ideal tech stack to ABM targeting criteria
- Using competitive installs, intent signals, and spend data to sharpen the list
- Segmenting, validating, and operationalizing the list across teams
- How HG Insights supports technographic-driven ABM
Firmographics create a starting point but rarely explain why an account actually converts
Firmographics describe an organization at a high level, but those attributes say little about compatibility with your offering. Two software companies may sit in the same industry category and generate similar annual revenue while their technology environments look completely different.
One company may run a mature cloud ecosystem with several integrated platforms. The other still relies on fragmented systems that create implementation friction. A firmographic filter treats them identically. Technographic data would separate them immediately. HG Insights data across 99,008 US companies in the 200–2,000 employee range shows just how wide that divergence runs: only 30.4% use Salesforce CRM and 6.4% use HubSpot; meaning nearly two-thirds of firmographic lookalikes are running a completely different platform.
Lists built around firmographics alone tend to become bloated. Marketing sends campaigns toward accounts that appear attractive on paper while sales spends time pursuing organizations that never had a strong fit. That creates a trust problem. When reps see too many accounts that look right but go nowhere, they start treating the ABM list as marketing’s wishlist rather than a shared revenue plan. The list loses influence, campaign spend spreads too thin, and high-fit accounts get buried beside accounts that never had a real path to conversion.
Understanding how technographic data works as a targeting layer makes the distinction between what a company looks like and how it actually operates immediately apparent.
Technographic data reveals the operational reality behind the company profile
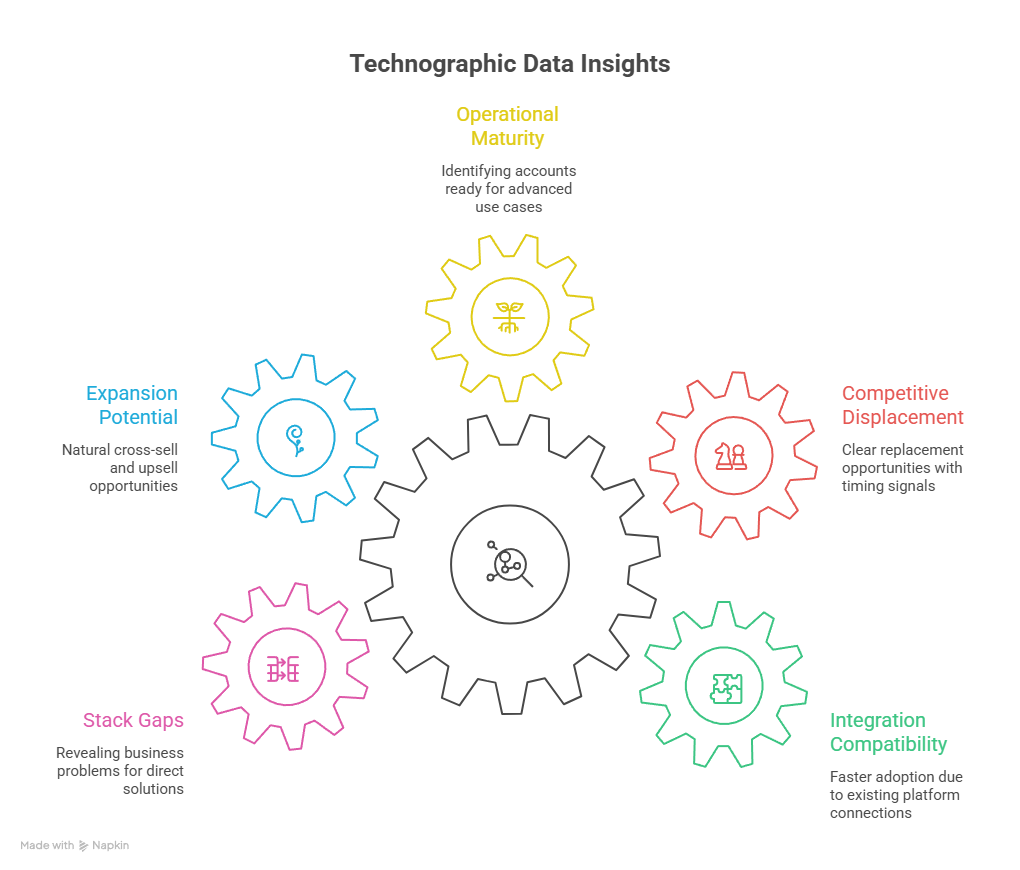
Technographics show the tools, applications, and infrastructure already operating inside an account. That information reveals deeper signals than company attributes alone:
- Integration compatibility. Accounts already using platforms your solution connects with or enhances represent a faster path to adoption.
- Competitive displacement opportunities. Accounts running incumbent tools create a clear replacement conversation when paired with timing signals.
- Operational maturity. Your team can separate accounts ready for advanced use cases from accounts still building foundational capabilities.
- Expansion potential. Existing tools may suggest a natural cross-sell, upsell, or partner-led motion.
- Stack gaps. Missing capabilities reveal business problems your sales and marketing teams can speak to directly. Analysis of HG Insights install data shows 61.3% of US companies with 500 or more employees running Salesforce CRM have no data warehouse alongside it; the kind of infrastructure gap that surfaces a real business problem your team can speak to directly.
A company using a sophisticated CRM, cloud platform, and analytics stack typically behaves differently in a sales process than one using disconnected legacy systems. That behavioral difference is invisible in firmographic data but immediately apparent in technographic data.
HG Insights surfaces this distinction directly, combining verified technology install data, competitive product usage, cloud maturity signals, and IT spend patterns at the account level to show how an account actually operates, not just how it appears on paper.
Your strongest customers leave a technology pattern behind; use it to define ABM fit
Strong account selection starts with understanding the patterns in your best customer base. Review customers with healthy retention, larger deal sizes, and faster sales cycles. Look for technologies appearing repeatedly across those accounts.
Shared platforms often reveal stronger ABM account selection signals than demographic characteristics because they indicate which accounts already operate in an environment where your product makes sense. A mid-market company running Salesforce, Snowflake, and AWS may be a stronger fit than a larger enterprise running incompatible infrastructure, even though the firmographic filter would rank the enterprise higher. HG Insights install data shows that 38.7% of US companies with 500 or more employees running Salesforce CRM also have Snowflake deployed: a technology pairing that consistently appears in data-mature organizations with higher adoption readiness for additional platforms.
Translate those patterns into rules for account inclusion and exclusion:
- Inclusion signals may include specific CRM platforms, cloud environments, data infrastructure investments, or complementary applications that indicate readiness
- Exclusion signals may include incompatible platforms, low-maturity systems, or technology environments that limit adoption potential
When your scoring model reflects actual buying patterns, sales teams understand why an account belongs on the list. Building account scoring models tied to real fit signals gives your team a prioritization framework that reflects actual opportunity rather than whichever accounts happened to enter the CRM first.
Competitive installs surface displacement targets that are often more reachable than greenfield accounts
When a prospect uses a competing solution, marketers can shape account-based campaigns around likely pain points, renewal timing, integration gaps, or upgrade opportunities. Greenfield accounts often require category education and budget creation. Existing competitor customers already understand the category, already spend money in the space, and already support technology adoption internally. In HG Insights data across 38,285 US mid-market companies running Salesforce or HubSpot CRM, 15.4% are on HubSpot: a concentrated pool of accounts with category budget already approved, technology adoption already supported, and an active stake in the space.
Install intelligence becomes significantly stronger when paired with contract timing and renewal windows. An account running a competing solution while showing research activity around related topics tells a very different story than a dormant account with an existing install. Sales conversations become more relevant when outreach arrives during active evaluation periods rather than landing in the middle of a multi-year commitment.
HG Insights pairs competitive install intelligence with contract timing signals, so your team can identify which accounts are approaching renewal windows and time outreach to land during active evaluation rather than mid-commitment.
For a broader look at how to structure your target account list within a GTM context, building a target account list for your go-to-market connects account selection to the broader motions your list needs to support.
Intent and spend signals layered on technographics separate high-priority accounts from static lists
Technographics tell you who fits your solution. Intent data reveals who may be researching right now. IT spend data adds financial context that confirms whether an account can act on that interest. Across 33,286 US companies with 500–5,000 employees, HG Insights spend data shows an average of $304,000 per year allocated to sales and marketing software. That budget is already committed. Spend and intent signals together show which accounts are actively moving it toward a new decision.
A company can show heavy research activity while having limited spending potential. High spending potential without active buying signals can produce target lists that sit untouched for months. Either signal alone produces an incomplete picture.
The highest-priority accounts are the ones where your team can combine technographic and intent data for sharper ABM targeting, then validate that interest with spend signals showing the account has the budget to move. That three-layer combination, fit plus timing plus financial capacity, consistently produces the strongest pipeline conversion rates.
Segment the list by technology pattern, not just industry, to design more relevant plays
Technographic segmentation gives your team a sharper way to group accounts because it reflects how companies operate, where their stack is mature, and which sales play fits the account’s situation.
Useful account segments include:
- Current competitor users who represent displacement opportunities
- Complementary technology adopters where your product extends existing capability
- High-fit accounts showing intent activity that warrant immediate outreach
- Accounts with technology gaps where missing capabilities create a clear business problem
- High-spend growth accounts investing in adjacent categories
Shared account intelligence should flow into CRM systems, marketing automation platforms, and advertising channels so sales and marketing work from a single account view. Technology environments shift regularly as new vendors enter accounts, budgets change, and buying signals rise or disappear. Quarterly reviews keep your list aligned with current conditions rather than the snapshot that existed when the list was first built.
Validate the list against your TAM and whitespace to catch what’s missing
A stronger ABM target account list should reflect your actual market opportunity, not just the accounts already sitting in your CRM. Cross-check the list against your total addressable market to see where coverage is strong, where it’s thin, and which high-fit accounts are missing entirely.
Whitespace analysis adds the reality check. It helps your team spot accounts with the right firmographic, technographic, spend, and intent signals that haven’t made it onto the current list. Without that step, your team may overprioritize familiar accounts while stronger opportunities sit in undercovered segments, territories, or competitors’ installed bases.
The validation step often reveals that the next quarter’s pipeline growth doesn’t require expanding into new segments. It requires finding the high-fit accounts within existing segments that the current list missed.
Operationalize the list so sales and marketing work from the same view
A technographic-enriched list is only useful when sales and marketing share the same definitions, priorities, and follow-up process. Sync the list into your CRM, marketing automation platform, and ad audiences so each team sees the same account fit, technology install, spend, and intent signals.
Quarterly refreshes keep the list grounded in current market reality. Tech stacks change, vendors get displaced, budgets shift, and new buying signals appear. Regular updates keep ABM account selection accurate, route high-fit accounts into the right plays, and prevent stale data from shaping pipeline decisions.
The operational discipline of keeping the list current is what separates ABM programs that produce consistent pipeline from those that perform well in the first quarter and then degrade as the data underneath them ages.
HG Insights supports technographic-driven ABM from list building through ongoing refresh
Technographic data gives your team a better way to decide which accounts belong on the list, which deserve immediate focus, and which plays sales and marketing should run next. Firmographics still matter, but they don’t reveal how an account operates, what it already uses, where competitors are installed, or how ready the account is to act.
HG Insights provides verified install data, IT spend intelligence, buyer intent signals, and contract intelligence at the account level through the Revenue Growth Intelligence Platform. Those inputs support ABM list building, segmentation, account scoring, and ongoing refresh so your target account list reflects current market conditions rather than the assumptions it was originally built on.
Build an ABM target account list your sales team can trust. See how HG Insights powers technographic-driven ABM.