
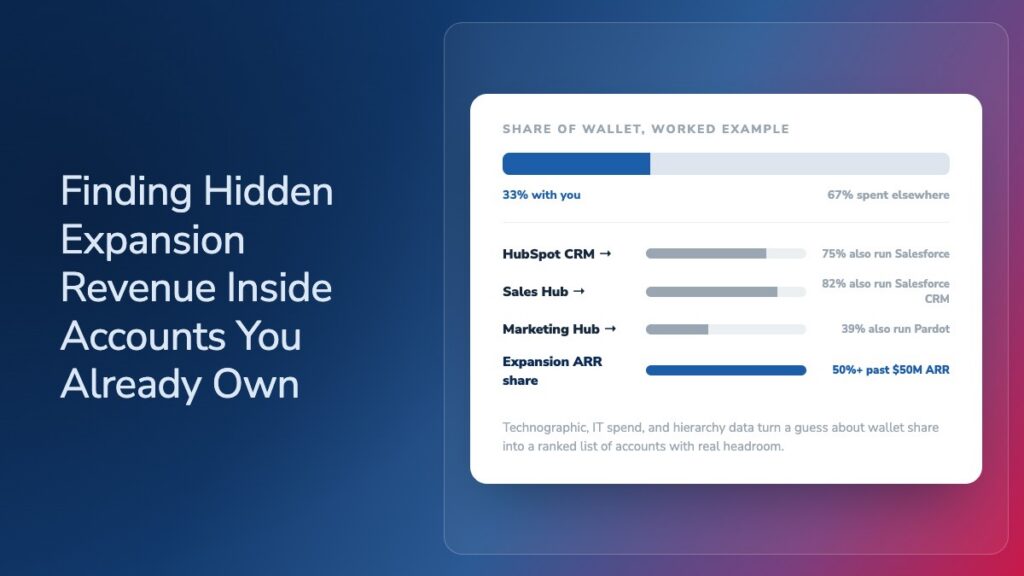
Share of wallet tells you how much of a customer’s total category spend your company actually captures, and for most B2B revenue teams, that number is lower than the pipeline reports suggest. Growing it does not require new logos or a bigger addressable market. It requires a repeatable way to size what an account already spends outside your contract, then a plan to close that gap. This post covers how to calculate share of wallet, what data the calculation needs, and how to turn the findings into cross-sell and upsell plays.
Quick answer: Share of wallet is the percentage of a customer’s total spending in a category that goes to your company instead of a competitor. You calculate it by dividing what the account spends with you by its total spend in that category, then multiplying by 100. B2B teams use it to find expansion revenue inside accounts they already own.
What is share-of-wallet analysis?
Share of wallet, also called wallet share, is a customer-level metric that measures the percentage of one account’s total spend in a category that goes to your company rather than a competitor. It is not the same as market share, which measures your company’s total revenue against the entire market.
A share-of-wallet analysis is the process of answering that question at scale, account by account, so a revenue team can see which customers have room to spend more with them and which are already maxed out. The output is not a single company-wide number. It is a ranked list of accounts by expansion headroom, which is what makes the metric useful to a RevOps or sales operations leader building a growth plan.
Share of wallet vs. whitespace analysis vs. market sizing
Share of wallet gets confused with two adjacent GTM disciplines, and the mix-up costs teams time. Whitespace analysis looks outward. It finds net-new accounts and adjacent segments your company has not sold into yet, using technographic and spend data to spot where a competitor is installed or where a segment is underpenetrated. Market sizing, through a TAM, SAM, and SOM model, answers a different question again: how big is the total opportunity across an entire market or category, independent of who you have already sold to.
Share of wallet operates strictly inside the accounts you already have. It uses their existing spend footprint, not the broader market, as the denominator. A useful way to keep the three straight: market sizing tells you how big the pie is, whitespace analysis tells you which new plates to serve, and share of wallet tells you how much more you can put on the plates already on the table.
If the real question behind a growth conversation is “where are the accounts we have not touched yet,” that is a whitespace analysis problem HG Insights solves through a different motion, not a share-of-wallet one. Teams sizing the addressable market from scratch should start with a TAM, SAM, and SOM framework instead. Share of wallet is for the accounts already signed.
Why share of wallet matters for B2B revenue growth
Most B2B revenue teams already know that growth is cheaper inside an existing account than outside one. Expansion revenue already makes up roughly 40 percent of new annual recurring revenue across B2B SaaS companies, and that share climbs past 50 percent once a company passes $50 million in ARR, according to Data-Mania’s 2026 B2B SaaS Benchmarks report. The sales cycle is shorter, the acquisition cost is close to zero, and the champion inside the account is already sold on the product.
That gap in share of wallet is measurable long before an analysis begins. HG Insights data shows that 75 percent of companies with 100 or more employees running HubSpot CRM also have Salesforce CRM installed somewhere in the organization. Even a customer that looks fully committed to one vendor is rarely spending its entire CRM budget there.
The problem is not agreement on the strategy. It is execution. In practice, expansion conversations tend to run on instinct: a CSM notices a department using the product heavily and flags it to sales, or a rep remembers a comment from a QBR six months ago. Internal research across enterprise accounts running active expansion motions found reps repeatedly unable to separate a genuine expansion opportunity from a net-new one, because the account hierarchy and spend footprint were not mapped clearly enough to tell the difference.
Share of wallet fixes that by replacing instinct with a number. Once an account’s total category spend is known, the gap between what it spends and what it spends with you is not a guess anymore. It is a target.
How to calculate share of wallet for an account
The basic formula
The standard formula is simple: divide what an account spends with your company by its total spend in the category, then multiply by 100.
Share of wallet = (revenue from the account ÷ account’s total category spend) × 100
The hard part in B2B is the denominator. A consumer brand can often get total-category spend from a loyalty card or a bank partnership. A B2B seller has no such shortcut. An account’s total spend on, say, marketing automation or cloud security tooling is not something it will hand over in a QBR. That is where technographic and IT spend data replace the survey a consumer brand would run.
A worked B2B example
Say a mid-market account pays your company $80,000 a year for a data enrichment product. Technographic and spend data show the account’s total annual spend across data enrichment, intent, and technographic tools, including two other vendors it runs alongside you, comes to $240,000.
Share of wallet = ($80,000 ÷ $240,000) × 100 = 33 percent
That account is spending two-thirds of its category budget somewhere else. Whether that gap is expansion headroom or a signal the account is happy running a multi-vendor stack depends on what those other tools do and whether they overlap with your product. That context is the next input the framework needs.
The data you need: spend, technographic, and install signals
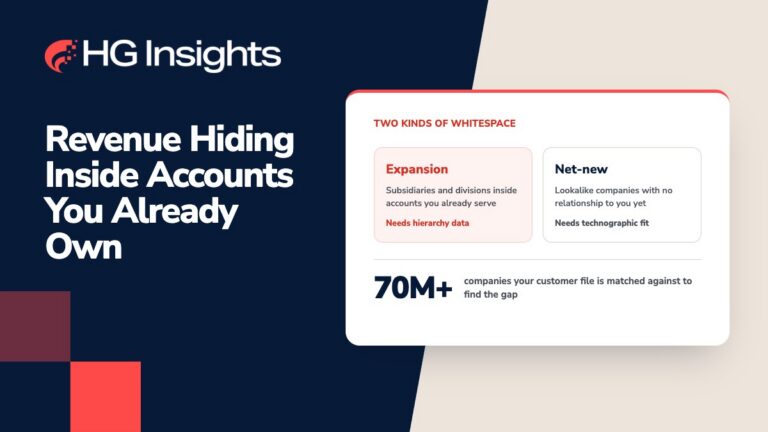
Running this calculation across an account base, rather than one account at a time, requires three data types working together. Technographic data shows which tools an account has installed, including competitors and adjacent products, with first and last verified dates so you know whether a tool is active or stale. IT spend data estimates what an account is actually paying across a category, not just what tools it uses, drawing from a taxonomy broad enough to cover the category you compete in. Corporate hierarchy data ties parent accounts to subsidiaries and divisions, so spend attributed to a business unit gets rolled up to the account you actually sell to, instead of getting lost as a separate, unrelated company.
A framework for finding expansion revenue in existing accounts
Turning a share-of-wallet number into pipeline takes a four-step motion, and it plays out differently depending on which team is running it.
For RevOps and sales operations
For RevOps and sales operations, the work starts with segmentation: rank every existing account by its calculated share of wallet, from most maxed-out to most underpenetrated, and layer in deal size and renewal timing so reps are not chasing headroom in an account that is a year away from its next budget cycle. The output should be a short list, not a spreadsheet of every logo in Salesforce. The pattern shows up clearly in HG Insights data: 82 percent of companies with 100 or more employees running HubSpot Sales Hub also run Salesforce CRM, exactly the kind of overlap this segmentation step is built to surface.
For account teams and customer success
For account teams and customer success, the number becomes a talk track. An account at 30 percent share of wallet is not a renewal risk, it is an expansion conversation, and knowing which specific adjacent category the remaining 70 percent is going to, whether that is a named competitor, an internal build, or an unrelated vendor, tells the CSM exactly what to bring to the next check-in.
For marketing and demand generation
For marketing and demand generation, low share-of-wallet accounts running a competing tool are candidates for account-based campaigns built around displacement messaging rather than generic upsell content, because the buying committee already has a point of comparison in front of it. The overlap is bigger than most marketers assume: 39 percent of companies running HubSpot Marketing Hub also run Salesforce Pardot, so a “HubSpot account” is often only capturing a little over a third of that customer’s marketing automation spend before anyone accounts for the rest of the stack.
The common thread across all three is the same input: an account-level spend map that did not exist before the calculation was run.
Common pitfalls when running a share-of-wallet analysis
Three mistakes show up most often once teams start running this analysis at scale.
The first is treating the denominator as static. An account’s total category spend moves as fast as its headcount and its tech stack, so a share-of-wallet number calculated once at contract signing is already stale by the next renewal.
The second is skipping the hierarchy check. Rolling up subsidiary and parent-company spend incorrectly either inflates the denominator with revenue you were never going to touch, or misses spend sitting one level down in a business unit that reports up to the account you already own. The risk is not theoretical: among companies with 1,000 or more employees running Salesforce CRM, 17 percent also have HubSpot CRM installed somewhere in the business, often inside a subsidiary that never shows up in the parent account’s Salesforce instance.
The third is treating every low-share account the same way. An account spending the other 70 percent on a direct competitor needs a displacement play. An account spending it on five unrelated point solutions needs a consolidation pitch. Both look identical in a spreadsheet until someone checks what the money is actually buying.
Build expansion plans with HG Insights
Everything in this framework depends on knowing what an account spends outside your contract, and that data is the part most revenue teams do not have in house. HG Insights’ RGI Fabric combines technographic, IT spend, and corporate hierarchy data across more than 40 million companies into a single data layer, so the denominator in a share-of-wallet calculation is built from verified installs and spend estimates instead of a guess made on a sales call.
Market Analyzer sits on top of that data to run the segmentation itself: rank accounts by expansion headroom, roll up spend across parent and subsidiary structures automatically, and separate accounts where the gap is genuine whitespace from accounts where a named competitor already owns the remaining budget.
A demo focused on account-level spend and install data shows this framework running against your own book of accounts, not a sample dataset. Schedule a demo to see how it applies to the accounts your team already owns.
Frequently Asked Questions
What is share of wallet in sales?
In sales, share of wallet is the percentage of an account’s total spend in a product category that goes to your company rather than a competitor or an internal build. Sales teams use it to identify which existing accounts still have budget going elsewhere and to prioritize expansion conversations over net-new prospecting.
What is share of wallet in marketing?
In marketing, share of wallet informs account-based campaigns aimed at existing customers rather than net-new prospects. Marketing teams use the metric to decide which accounts need displacement messaging against a named competitor and which need consolidation messaging aimed at replacing several smaller point solutions with one platform.
How is share of wallet different from market share?
Market share measures a company’s total revenue against an entire market or industry. Share of wallet measures a single customer’s spend with your company against that same customer’s total spend in a category. A company can lose market share while growing share of wallet in its existing accounts, or the reverse.
How do you calculate share of wallet for a B2B account?
Divide the account’s annual revenue with your company by its total annual spend in the category, then multiply by 100. The account revenue side is usually known from your own systems. The total category spend side typically requires technographic and IT spend data, since B2B accounts rarely disclose full category budgets directly.
What data do you need to run a share-of-wallet analysis?
A share-of-wallet analysis needs three data types: technographic data showing which competing or adjacent tools an account has installed, IT spend data estimating category-level spend, and corporate hierarchy data that rolls subsidiary spend up to the correct parent account so the denominator is not under- or overstated.
How can distributors increase share of wallet?
Distributors increase share of wallet by identifying which accounts are already buying adjacent products from other suppliers and building bundled offers, volume incentives, or category expansion plays around that specific gap, rather than running the same generic cross-sell pitch across every account in the territory.