

Low-cost technographic data looks attractive on a budget line item, but the issue often arises later, when segmentation, scoring, and outreach begin to falter. Technographic data quality directly shapes GTM data reliability, and small inaccuracies compound fast inside modern revenue engines.
When you’re evaluating data providers, you’re rarely debating price alone. The harder question is: does this data actually improve targeting, prioritization, and pipeline performance?
The hidden risk behind low-cost technographic data
Low-cost technographic data often prioritizes volume over accuracy. Large record counts can look impressive in a demo, yet surface-level coverage doesn’t guarantee technographic data accuracy across enterprise accounts or complex buying groups.
You may assume B2B technographics are interchangeable, but, in practice, detection methods, refresh cadences, and validation rigor vary widely. When that variation goes unnoticed, data quality becomes a foundational performance issue rather than a minor enrichment gap.
As many leaders discover when addressing broader GTM data challenges, weak upstream inputs distort downstream execution. The issue rarely starts with sales; it starts with the intelligence layer.
How low-quality technographic data enters GTM systems
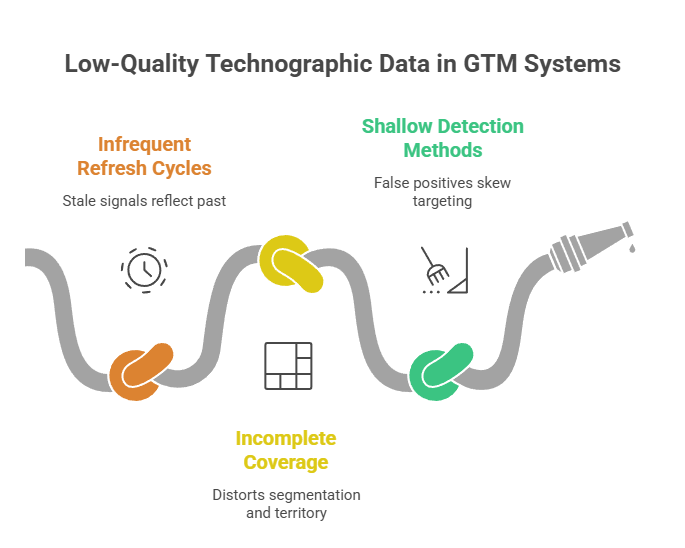
Low-quality signals may not look broken at first glance. They enter CRM and warehouse environments as “good enough” enrichment, then spread quietly across models, routing rules, and dashboards. The ways low-quality technographic data enters GTM systems include:
- Infrequent refresh cycles and stale signals
- Incomplete coverage across markets and segments
- Shallow detection methods
Infrequent refresh cycles and stale signals
Technology stacks change constantly as contracts renew, cloud migrations accelerate, and tools consolidate after acquisitions. Cheap data sources often update quarterly or less, which means install flags may reflect a past operating environment.
According to MarketingSherpa research referenced by HubSpot, B2B data typically deteriorates at an annual rate of about 22.5%.
Most cheap vendors don’t distinguish between a tool confirmed running last week, one detected 14 months ago with no re-verification, and one inferred from adjacent signals rather than directly observed. All three show up the same way in the data: installed. Your scoring model can’t tell the difference.
HG Insights classifies installs as current, historical, or inferred. That distinction matters when you’re deciding which accounts to prioritize and which competitor displacement plays to run. A flag that doesn’t tell you how fresh or how certain it is isn’t a signal. It’s noise dressed up as one.
| Install Signal | What It Actually Tells You | The Risk When a Cheap Vendor Just Labels It “Installed” |
|---|---|---|
| Current | Tool confirmed running recently through direct, re-verified detection | This is the signal you can act on. Safe to prioritize and to build displacement plays around |
| Historical | Tool detected in the past, sometimes 14 months ago, with no re-verification. May already be replaced | Outreach references a tool the account dropped. Expansion plays launch into accounts that centralized elsewhere |
| Inferred | Tool assumed from adjacent or surface signals, never directly observed | False positives trigger the wrong displacement play and skew scoring. Reps stop trusting the data altogether |
When installed technologies are outdated, teams assume fit and readiness where none exists. Outreach references tools already replaced; expansion plays launch into accounts that have centralized systems elsewhere.
Incomplete coverage across markets and segments
Low-cost providers frequently lack depth in the mid-market and enterprise segments, and the resulting coverage gaps can distort segmentation and territory design.
Blind spots tend to show up in:
- Underestimated TAM in specific industries
- Overrepresented SMB accounts with visible web signals
- Weak international coverage
- Missing internal systems that influence spend
Market sizing, ICP design, and segmentation insights suffer when data enrichment quality varies by segment.
HG Insights’ Market Analyzer addresses this at the source. Instead of building TAM estimates from firmographic proxies like industry code and employee count, it uses verified install and spend data. The segments you prioritize end up reflecting how companies actually buy, not which ones look like they theoretically should.
Shallow detection methods
Many low-cost vendors rely heavily on surface scraping and broad inference. Although public-facing scripts reveal some tools, internal systems and nuanced deployments remain invisible.
False positives create a larger issue than missing values. A wrong competitor install triggers the wrong displacement play; an incorrect platform flag skews predictive targeting accuracy. Over time, your reps stop trusting the signals altogether.
If competitive displacement is part of your GTM motion, timing is the difference between a relevant conversation and a wasted call.
See how HG Insights identifies competitor installs, estimates renewal windows, and helps you build displacement plays that reach accounts before the decision is already made. Explore competitive analysis and takeout
The downstream impact on GTM performance
The real damage occurs when flawed technographics feed into scoring engines, AI copilots, and sales sequences. Downstream effects of bad technographics are:
- Misaligned ICPs and segmentation models
- Inaccurate scoring and prioritization
- Ineffective sales and marketing execution
Misaligned ICPs and segmentation models
Technographics often define ICP criteria. Poor inputs distort lookalike modeling and whitespace analysis.
The mechanism is direct. ICP criteria typically include technographic filters: companies running a specific CRM, a cloud platform, a security stack that signals enterprise maturity. When those install signals are wrong, the model selects accounts based on attributes they don’t actually have. It isn’t broken. It’s doing exactly what it was told, on bad instructions.
That creates two distinct problems that feed each other. Lookalike modeling pulls in accounts that resemble your best customers on the surface but don’t share the tech environment that made those customers a fit. Whitespace analysis misses genuinely high-fit accounts because their install data was incomplete or stale when scoring ran. Neither problem announces itself. Both show up slowly, as rep feedback that “the list doesn’t feel right” and conversion rates that don’t match the model’s confidence scores.
Building ICP criteria on verified technographic data changes what the model is actually selecting for. HG Insights distinguishes between accounts that actively run a technology and those where a tool was detected once, never re-verified, and may have nothing to do with how that account operates today.
You end up chasing accounts that were never a fit. GTM performance issues emerge when the model itself was trained on faulty assumptions.
Inaccurate scoring and prioritization
AI amplifies the quality of its inputs. Models built on weak technographic data won’t self-correct; they scale the error.
The problem runs deeper than bad inputs. When scoring logic is opaque, you can’t trace why a specific account landed where it did. You just watch the model perform badly and watch rep trust go with it.
HG Insights uses transparent, auditable scoring. Every account score connects back to the specific signals that drove it, and your data team can inspect, adjust, or override any of them. Buyers who evaluated black-box platforms, including tools where scoring methodology is proprietary, consistently point to this as the reason they left: not capabilities, but the inability to see inside the model.
In predictive account targeting and scoring, a single inaccurate install flag can push low-fit accounts to the top of the queue. High-fit accounts without detected tools drop below the threshold. Pipeline forecasts lose credibility.
Ineffective sales and marketing execution
Sales outreach loses credibility when tech context is wrong. Reps reference tools the account doesn’t use; messaging misses timing.
The failure is concrete. A rep walks into a discovery call referencing a security platform the prospect replaced 14 months ago. The prospect notices. That moment doesn’t just kill the call. It signals that your entire intelligence layer is unreliable, and that signal travels fast. Reps who get burned by wrong data stop using it. They build workarounds, develop personal exceptions to the official signals, and route around the system entirely. The intelligence investment produces nothing.
Marketing runs into the same problem from a different angle. Campaigns built on incorrect stack assumptions generate low engagement, which gets misread as a messaging or audience targeting issue. The actual cause, bad technographic inputs corrupting segmentation, stays invisible. The response becomes testing new creative or adjusting spend rather than fixing what’s underneath.
That misdiagnosis is expensive. Teams spend cycles optimizing the wrong variable while the root problem compounds.
Verified technographic data breaks this pattern. When reps trust that a detected install is current, they use it. When marketing builds segments on real stack data, engagement reflects actual audience fit rather than data noise. The alignment problem that plagues most GTM teams often isn’t a communication problem. It’s a shared data problem in disguise.
Why technographic quality matters more than cost
Technographic data should be evaluated based on revenue intelligence data impact, not subscription price.
Accurate technographics improve revenue predictability
Consistent technographic data quality improves targeting stability across teams.
One enterprise technology company came to HG Insights after years with a previous vendor. Their account match rate was 43%. That number sounds like a rounding error, but in practice it meant more than half their prospect universe was either missing or wrong, which distorted everything built on top of it: territory design, scoring weights, outreach sequencing.
Through iterative work on hierarchy matching, domain anchoring, and regional reconciliation, that rate reached 89%. Same accounts, same markets, same sales team. The difference was what lived underneath.
Forecast accuracy increases when scoring models and segmentation logic rely on trusted inputs.
Reliable data strengthens AI-driven insights
AI initiatives struggle when underlying data is incomplete or inaccurate. Leaders report wasted resources training models on flawed datasets.
High-quality technographics enable meaningful predictive analysis because signals reflect current reality. Signal-based account prioritization becomes grounded in evidence rather than inference.
Trust in data drives adoption and execution
Only 35% of sales professionals fully trust their organization’s data, but when technographic data accuracy improves, confidence rises.
Broader adoption across sales, marketing, and analytics usually follows when teams view the intelligence as trustworthy, useful, and grounded in reality. Platforms offering an account intelligence data fabric unify various signals and create shared visibility, strengthening execution consistency across the board.
What to look for in high-quality technographic intelligence
Evaluating providers requires looking beyond record counts.
Verified detection and continuous refresh
Ask about detection methodology, validation processes, and refresh frequency. Frequent updates reduce stale installs and limit false positives.
Having clear differentiation between current, historical, and inferred installs increases technographic data quality and accuracy.
Depth across technologies, spend, and context
Strong technographics connect tools with spend patterns and organizational context. Revenue Growth Intelligence improves when install data aligns with IT spend, contract timing, and expansion potential.
HG Insights layers verified IT spend data alongside install signals, which means you can tell the difference between an account actively funding a technology category and one running legacy tooling it hasn’t touched in two years.
That level of depth gives teams a stronger basis for making more precise segmentation choices and more confident prioritization decisions.
Integration with market and buyer signals
Technographics gain power when integrated with spend and buyer intent signals. Combining fit and in-market activity produces holistic account intelligence data that supports precise activation.
HG Insights surfaces estimated contract renewal windows alongside competitor install data, so outreach reaches accounts when they’re actively evaluating alternatives rather than after the renewal is already signed.
The role of RevOps in protecting GTM data quality
RevOps should define standards for data enrichment quality and evaluate vendors against operational use cases, not just field availability.
Strong governance links intelligence directly to execution. Reviewing feedback loops between sellers, campaigns, and scoring models helps prevent downstream GTM performance issues tied to weak inputs.
Teams assessing RevOps use cases often discover that data quality drives revenue outcomes as much as process design.
Protect GTM performance with trusted technographic intelligence
Low-cost technographic data often creates hidden costs in lost productivity and missed revenue. Technographic data quality determines whether your targeting, scoring, and execution reflect reality or assumptions.
At HG Insights, we built our platform to directly address this gap. Our Revenue Growth Intelligence platform combines verified technographics, IT spend, buyer intent, and AI-driven activation, enabling GTM teams to size markets accurately, prioritize the right accounts, and execute with confidence.
Book a demo to see how HG Insights verifies technographic installs, layers in IT spend context, and gives your scoring models the accuracy they need to prioritize the right accounts.