
Most ABM programs segment on firmographics and stop there. Company size, industry, revenue, region tells you who an account is. Unfortunately, it doesn’t tell you what they run, whether your product fits their stack, or whether they’re sitting on a contract that’s about to come up for renewal.
That gap is exactly where ABM spend gets wasted.
Two accounts can look identical on a firmographic profile and behave nothing alike once you see their technology. One already runs a tool that pairs with yours. The other is locked into a competitor with two years left on the deal. Same tier, opposite readiness.
Technographic data closes that gap. It’s the layer that turns a broad tier into a segment built around real product fit. This post walks through how to use it: how to group accounts by the technologies they already run, where the displacement opportunities hide, and how install data feeds your scoring and tiering so campaigns reach the accounts most likely to convert.
How do you use technographic data for ABM segmentation?
You group accounts by the technologies they already run, then layer that install context on top of firmographic and intent signals to build precise, high-fit segments. Instead of one broad “enterprise SaaS” tier, you get segments like “runs a complementary platform and shows buying intent” or “runs a competitor and just changed CISOs.”
The payoff is that spend follows readiness. The method surfaces accounts with genuine product fit and clear competitive displacement potential, so reps and campaigns work the accounts most likely to move, not just the ones that look big on paper. In this article, we’ll cover:
- Why firmographics alone leave ABM segmentation incomplete
- What technographic data adds to ABM segmentation
- Building segments around the technologies accounts already use
- Using install data for competitive displacement
- Layering technographics with firmographics and intent for scoring
- Tiering accounts for precision targeting
- Aligning sales and marketing around shared technographic segments
- How HG Insights powers technographic ABM segmentation
1. Why firmographics alone leave ABM segmentation incomplete
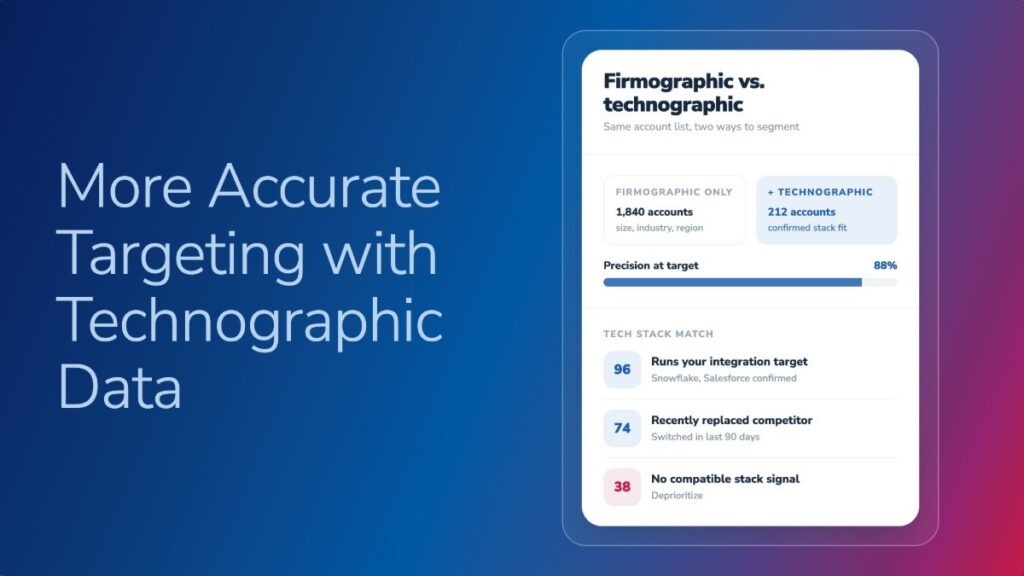
Firmographics are good at sizing and sorting. They group accounts by employee count, revenue, industry, and geography, which is enough to build tiers and assign territories. What they can’t tell you is whether your product has a place in the account’s environment.
Two 3,000-person manufacturers in the same region read as one segment on a firmographic profile. But one runs an ERP that integrates with your tool out of the box, and the other runs a closed system that would take a year to rip out. Same size on paper, miles apart in readiness. Firmographics put them in the same bucket. Technographics pull them apart. That gap holds up at scale: across mid-market manufacturers globally, HG Insights install data shows only 2.6% of the ones running SAP ERP also have a modern integration layer like MuleSoft in their stack, so the account that already talks to your tool is the exception, not the rule, which is exactly why it’s worth finding.
That’s the limit. Firmographic fit tells you an account belongs in your market. It says nothing about timing or technical fit, and ABM lives or dies on both.
2. What technographic data adds to ABM segmentation
Technographic data is the record of what an account actually runs, including the software, hardware, cloud platforms, and tools in its stack. Where firmographics describe the company, technographics describe its environment, and the environment is where product fit gets decided. HG Insights tracks that environment at scale, verified technology installs across more than 120 million organizations, drawn from over 20 billion external data points, so the stack picture behind a segment reflects what’s actually running today, not a stale license record.
That changes what a segment can be. With install data, a tier stops being “mid-market fintech” and becomes “mid-market fintech running a payment platform we integrate with.” The first is a guess about fit. The second is evidence of it. You’re no longer targeting accounts that might need you. You’re targeting accounts whose stack already implies the need.
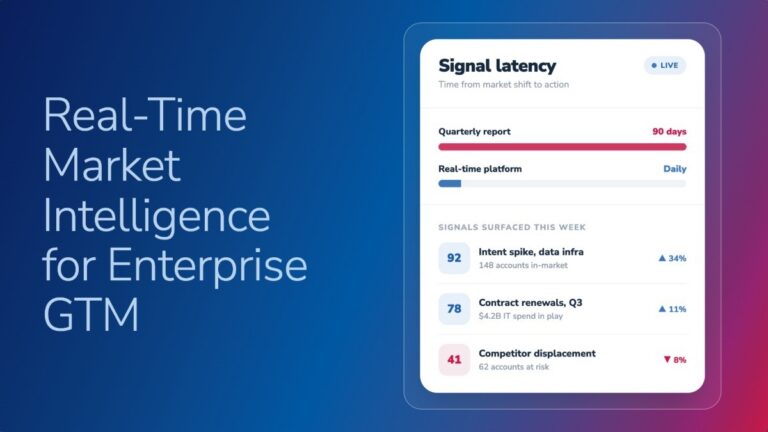
Install data also flags timing. A recent platform migration, a tool added last quarter, a competitor product nearing its renewal cycle, these are the moments when budgets open and evaluations start.
3. Building segments around the technologies accounts already use
Start by sorting accounts into three groups based on their stack: complementary, competing, and absent.
- Complementary accounts already run something your product pairs with, so the message writes itself: here’s how we extend what you already use.
- Competing accounts run a rival, which makes them a displacement play (more on that next).
- Absent accounts run nothing in the category, so the message has to build the case for the category itself, a longer sell.
Sorting this way decides which value proposition leads. A rep approaching a complementary account opens with integration. A rep approaching an absent account opens with education. Same product, different opening, and the difference comes straight from the install data. This is how high-fit account targeting gets specific enough to write campaigns around. In HG Insights’ RGI Platform, this sorting happens inside Market Analyzer and carries through to Sales Copilot, so reps see the complementary, competing, or absent tag on an account before they open a call script.
4. Using install data for competitive displacement
The competing-stack group is the most actionable segment install data produces. These accounts have already been bought in the category. They’ve been through procurement, they have a budget allocated, and they know the problem your product solves. The only open question is whether they’re happy with what they have.
That makes displacement a defined, high-intent segment rather than a hopeful pitch. You’re not convincing an account they need the category. You’re giving them a reason to switch. Frame the message around switching triggers: a price increase, a known integration gap, a support reputation that precedes the vendor, a contract window. Generic “we’re better” messaging bounces off these accounts. Specific “here’s what your current tool can’t do” lands.
Competitive displacement targeting works because the segment is built on certainty. You know what they run, so you know what to say.
5. Layering technographics with firmographics and intent for scoring
No single data type should carry a score alone. Firmographics confirm fit. Technographics confirm technical relevance and displacement potential. Intent data confirms the account is researching right now. Each one covers a blind spot the others have.
Stack them and the score gets honest. A large account with perfect firmographics but a competitor locked in on a fresh contract should rank below a mid-sized account running a complementary tool and spiking on intent. A firmographic-only model would rank those two backward. The layered model ranks by conversion likelihood, which is the only ranking that earns a rep’s time.
HG Insights feeds all three into account prioritization and scoring, and your tier list starts reflecting who’s actually ready, not who’s biggest.
6. Tiering accounts for precision targeting
Once accounts are scored on the layered model, map the segments to ABM tiers so spend follows fit. Tier 1 gets accounts with strong firmographic fit, a complementary or competing stack, and active intent, the ones worth one-to-one programs and direct sales attention. Tier 2 gets a good fit with weaker timing signals. Tier 3 gets broader nurture.
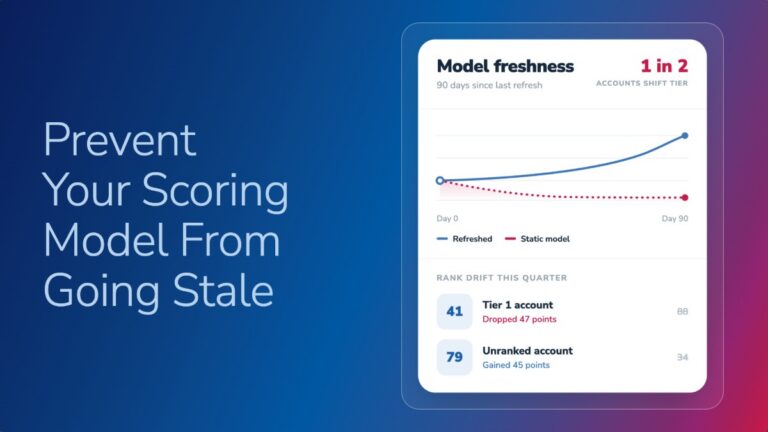
The part teams skip is that tiers aren’t static. Install and intent data refresh, and an account that sat in Tier 3 last quarter can jump to Tier 1 the week it adds a complementary tool or trips a renewal signal. Build the thresholds to move with the data. A tier list recalculated once a year is a list that’s wrong for most of it.
7. Aligning sales and marketing around shared technographic segments
ABM breaks when sales and marketing work off different account lists. Marketing runs campaigns against one segment, sales prioritizes another, and the account gets a marketing touch about integration while the rep is pitching displacement. Mixed signals, wasted spend.
One shared technographic segmentation view fixes that. When both teams see the same install context, this account runs a competitor, this one runs a complementary platform, outreach and campaigns reinforce each other instead of colliding. The rep’s call picks up where the campaign left off because they’re reading the same data.
Working the same prioritized accounts also cuts the wasted touches that quietly erode ABM returns. Fewer accounts, better coordinated, beats more accounts worked at random.
8. How HG Insights powers technographic ABM segmentation
HG Insights is built on technographic depth. That’s why 95% of Fortune 1000 B2B tech companies and every major hyperscaler run their GTM data on HG Insights. We track verified install data across software, hardware, and cloud platforms, so the stack picture your segments rely on reflects what accounts run now, not what they ran two years ago.
Then we enrich it. IT spend data shows the budget by technology category. Intent data shows active research. Firmographic data anchors fit. Together they give your team one dataset for the whole motion: building segments, scoring accounts, finding displacement targets, and setting tiers. That’s what separates technographic segmentation that holds up from a stale install list that decays the day you buy it.
Target ABM accounts by what they actually run
Ready to build segments off what accounts actually run? See how ABM Optimization turns install and intent data into ready-to-work tiers.