

Learning how to trust your market data starts with admitting most go-to-market teams cannot fully explain where their market number came from, and that is not a research failure so much as a design failure. It shows up the moment a strategy leader, a data leader, or a RevOps leader tries to answer a simple question: how big is this market, really, and can I defend that answer in a board meeting? The number usually gets assembled from three places that were never built to agree with each other. Understanding why that happens, and what actually closes the gap, is the difference between a market view you can act on and one you’re quietly hedging every time someone asks a follow-up question.
Quick Answer: GTM teams struggle to trust market data because they typically stitch it together from three incompatible sources: a static analyst report that updates quarterly at best, an activation platform built for targeting rather than sizing, and internal BI that only reflects what someone already fed it. No single source owns provenance, so no one can fully vouch for the final number.
How to Trust Your Market Data in an Industry Built on Borrowed Numbers
Ask a Chief Data Officer or a VP of GTM Strategy where their TAM number originated, and the honest answer is rarely a clean one. It’s a blend: a Gartner or Forrester figure from last quarter’s report, adjusted by whatever an activation platform surfaced as “in-market” accounts, reconciled against an internal spreadsheet someone built two planning cycles ago. Each piece was accurate on the day it was produced. None of them were built to be checked against each other, and none of them refresh on the same clock.
This isn’t a complaint about any single vendor or any single analyst. It’s a structural pattern that shows up anywhere a team tries to produce one trusted number from three disconnected inputs. A strategy leader defending a board-level forecast, a data leader deciding whether to build the pipeline in-house, a RevOps leader carving territory off last year’s assumptions: all three are running into the same wall from different directions. The problem isn’t a bad data source. It’s that ownership of the number is split three ways, and nobody holds the full chain of custody.
Why the Three-Way Data Gap Persists in B2B Market Intelligence
The gap holds together for a simple reason: each of the three sources solves a real problem, just not the whole problem, and each one has its own structural limit.
Static analyst research moves on its own clock
Analyst firms like Gartner and Forrester still produce the most defensible, board-recognized market sizing available, and that credibility is earned. But their research cadence is quarterly at best, and even that cadence can’t keep pace with how fast AI-driven IT spend is moving. Gartner revised its own 2026 forecast three separate times in 2025. That’s not a knock on Gartner’s rigor. It’s evidence that even the most authoritative source in the category can’t hold a static number steady for very long right now. A board-ready report from six months ago is a snapshot of a market that has already moved.
Activation platforms optimize for targeting, not provenance
Platforms built for intent and activation are excellent at telling a rep which account to call today. They are not built to answer a data leader’s question: where did this score actually come from, and can I trace it? Several of these platforms have taken public criticism for exactly this reason. 6sense and Demandbase have both faced black-box scoring critiques from data-literate buyers who want to see the methodology, not just the output. Apollo has faced a public dispute over a headline accuracy claim. Crunchbase has an unvalidated prediction claim of its own circulating in the market. None of this makes these tools less useful for what they’re built for. It does mean none of them were designed to answer a provenance question, and asking them to is asking the wrong tool for the job.
Internal BI inherits whatever it’s fed
The third leg, the internal BI layer, often gets treated as the “objective” source because it’s built in-house. It isn’t objective. It’s only as trustworthy as whatever combination of the first two sources someone loaded into it, on whatever day someone last updated the model. A Snowflake table full of last year’s analyst figures and this quarter’s activation-tool export is not a neutral arbiter. It’s a third version of the same underlying uncertainty, now wearing an internal badge of legitimacy it hasn’t actually earned.
Put the three together and the pattern is obvious: nobody in the chain owns a continuously refreshed, transparent, defensible number. Everyone is passing along someone else’s snapshot and hoping the seams don’t show.
How the Trust Gap Shows Up Across GTM Roles
For a VP of GTM Strategy, the gap surfaces as a board-defensibility problem. A forecast built on a static analyst PDF and reconciled against an activation tool’s account list is hard to defend when a board member asks how current the underlying spend data actually is. For a Chief Data Officer or Head of DataOps, the gap surfaces as a build-versus-buy decision made without real information: is it worth building an internal pipeline to replicate what a vendor claims to provide, when nobody can confirm the vendor’s methodology in the first place? For a RevOps leader, the gap shows up as territory and quota plans built on a segmentation that was already stale before the planning cycle started. For a product leader trying to validate a new segment or adjacency, it shows up as a near-total absence of any credible, refreshable data source, since almost none of the activation platforms address that question.
Different roles, same root cause. The number everyone is working from was assembled from parts that were never designed to reconcile.
Why Don’t GTM Teams Trust Their Market Data?
GTM teams don’t trust their market data because it’s typically stitched together from sources with conflicting refresh cycles and no shared methodology: a quarterly analyst report, an activation platform tuned for targeting rather than provenance, and an internal BI layer that reflects whatever was last loaded. The result: two teams in the same company can walk into the same quarter with two different TAM numbers, and neither one can say why theirs is right.
That distrust isn’t a sign of a bad team or a lazy process. It’s what happens by default when market sizing is assembled instead of sourced. The fix isn’t a fourth spreadsheet to reconcile the other three. It’s a single source built to be checked, not stitched.
Closing the Trust Gap with a Refreshable, Transparent Platform
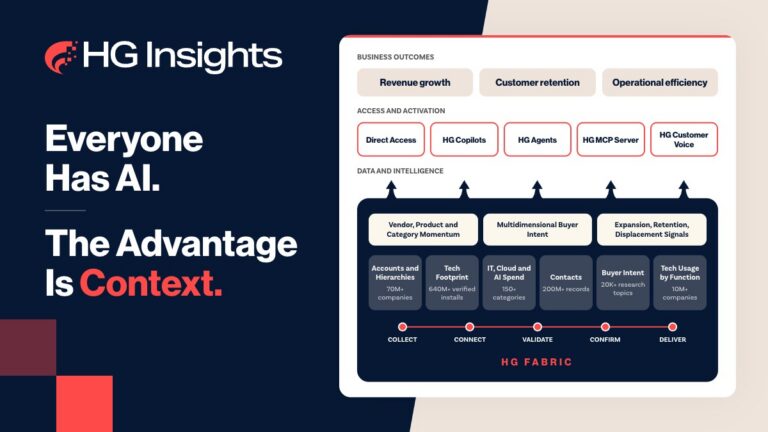
HG Insights built Market Analyzer to sit where the seam usually is: the point where analyst-grade defensibility should meet activation-grade currency, without asking a data leader to take either one on faith. The platform runs on twelve-month forward-looking IT spend projections across more than 140 spend categories, refreshed continuously rather than on a quarterly release schedule, with account-level drilldown so a strategy or data leader can trace a market number back to the underlying technographic and spend signal behind it. That drilldown is the point. Instead of asking a data leader to trust a black-box score, the methodology is visible on the same page as the number it produced. A strategy or data leader doesn’t have to build this trace by hand, either – Market Analyzer’s AI Co-Pilot walks through market definition, category selection, and account-level validation in a guided workflow, turning what used to be a multi-week research cycle into a same-day answer.
Customers running HG alongside their existing analyst subscriptions describe the same gap between a market report and an actual install-base number. As one enterprise software customer put it:
“Those other sources are great, but they don’t tell us the number of companies or the install base in a competitive space. HG Insights helps us complete that picture so we can make informed decisions about entering new markets.”
— Joe Hannum, Senior Manager of Customer Intelligence and Analytics, Hyland Software
This isn’t a claim to be unbiased, and it isn’t a replacement for analyst research. It’s a different kind of source, one built to be audited rather than taken on authority. See how HG Insights helps strategy and data leaders build a market view they can actually defend, refreshed on a cycle that matches how fast the market is moving instead of how fast a report gets published.
Building a Market View That Holds Up to Scrutiny
The three-way gap between static research, activation tooling, and internal BI isn’t going away on its own, because none of the three was designed to solve it. What changes the equation is a source built from the start to show its work: continuously refreshed, transparent about methodology, and drillable down to the account level. That’s the difference between a market number a team hopes holds up under a follow-up question, and one built to answer it.
Frequently Asked Questions
Why can't analyst reports alone be trusted for current market sizing?
Analyst reports from firms like Gartner and Forrester are rigorously researched, but they update on a quarterly or annual cycle. Gartner itself revised its 2026 forecast three separate times in 2025, which shows that even top-tier analyst research can fall behind a market moving as fast as AI-driven IT spend currently is.
What is black-box scoring, and why does it hurt data trust?
Black-box scoring is when a platform produces an account score or market figure without showing the underlying methodology or data inputs. Data leaders increasingly reject this because they can’t audit or defend a number they can’t trace, which is why several major activation platforms have faced public criticism on exactly this point.
Is internal BI a more objective source of market data than a vendor?
No. Internal BI is only as reliable as the data fed into it, which is usually a mix of analyst figures and activation-tool exports loaded on different days. It reflects the same underlying uncertainty as its source data, just relabeled as internal.
How is HG Insights different from an activation platform like 6sense or Demandbase?
HG Insights is built for market sizing and technographic install visibility with a continuously refreshed, transparent methodology, while activation platforms are built to prioritize and engage in-market accounts. The two serve different jobs, and HG is positioned upstream of activation rather than as a replacement for it.
How often should market sizing data actually refresh?
Given how quickly AI-driven IT spend is shifting, market sizing data ideally refreshes continuously rather than on a fixed quarterly or annual schedule. A number that’s accurate on the day it’s published can already be stale by the time a board or planning cycle uses it.