
Every account-scoring model in B2B revenue operations rests on some mix of firmographic and technographic data, yet the two get treated as interchangeable more often than they should. Firmographic data describes what a company is: its size, industry, and structure. Technographic data describes what a company runs: the tools already sitting in its stack. Confusing the two skews segmentation, wastes outbound effort, and weakens the account scores that RevOps and sales teams depend on every day.
Quick answer: Firmographic data describes a company’s organizational attributes, industry, employee count, revenue, and location. Technographic data describes the technology stack it actually runs. One data type segments accounts by who they are. The other segments them by what they use. Most B2B scoring models need both, layered together rather than treated as substitutes.
What is firmographic data?
Firmographic data is the set of organizational attributes that describe what a company is. Employee count, annual revenue, industry classification, headquarters location, and corporate hierarchy all fall under this category, the same variables an analyst would use to profile a business without looking at its technology at all. A 200-person regional bank and a 20,000-person global manufacturer are firmographic examples at opposite ends of the same spectrum, distinct on paper long before anyone checks what software either one runs.
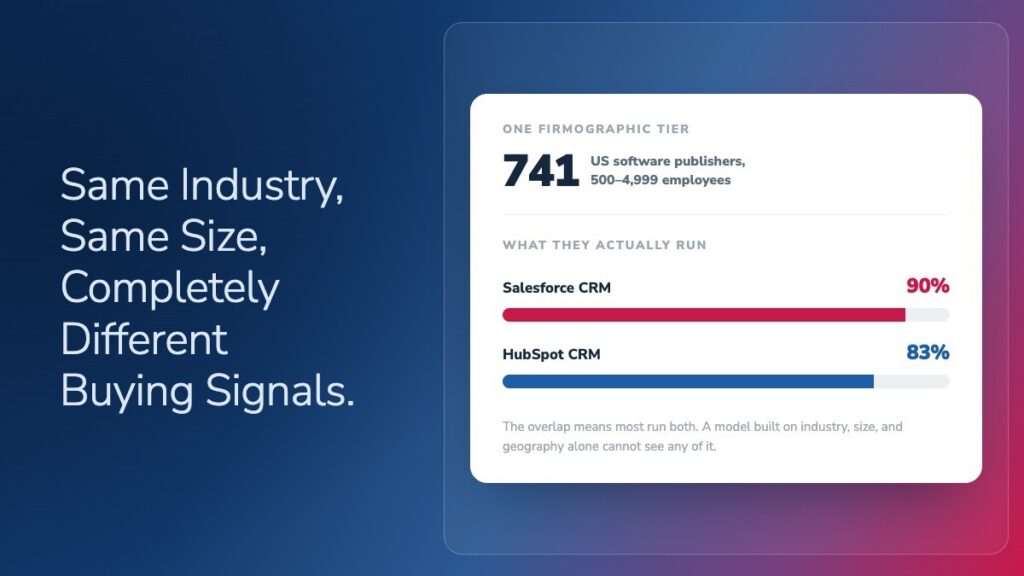
That flattening is easy to see at scale. HG Insights tracks 741 U.S. software publishers with 500 to 4,999 employees, exactly the kind of group a firmographic-only model would treat as a single scoring tier: same industry code, same country, same size band. Most firmographic data sources come from public filings, business registries, hiring activity, and vendor-maintained company databases, then get refreshed as companies grow, merge, or restructure. RevOps and marketing teams use it to answer a narrow but essential question: does this account fit the ideal customer profile on paper? That answer drives territory assignment, tier-based routing, and the first pass of nearly every segmentation model. It says nothing, though, about whether an account is actively evaluating a purchase or which competitor already has a foothold inside it. That gap is where technographic data takes over.
What is technographic data?
Technographic data describes the technology a company actually has installed and running, not what it claims in a case study or a careers page. This includes verified software and platform installs, cloud infrastructure choices, marketing and sales tool stacks, and the timing signals around when those tools were adopted or are due for renewal. HG Insights, for one, tracks verified technology installs across more than 120 million organizations, built from over 20 billion external data points spanning job postings, code repositories, website tags, and vendor disclosures.
Where firmographic data profiles a company’s structure, technographic data profiles its behavior. Two firmographically identical software companies can be technographically worlds apart: one running a modern cloud data stack, the other still dependent on legacy on-premise systems nearing end of life. That difference matters for competitive displacement, since it reveals not just who to target but which pitch, migration story, or renewal-timing play will actually land. For a deeper walkthrough of how this data gets collected and used, see Technographics 101.
Firmographic vs. technographic data: the key differences
Firmographic data profiles what a company is: its size, industry, revenue, and structure. Technographic data profiles what a company does with technology: the specific platforms, tools, and systems it runs. Firmographic data changes slowly, tied to headcount and org charts. Technographic data changes constantly, tracking every new install, upgrade, and renewal cycle.
The two also behave differently as inputs to a scoring model, not just as concepts. Firmographic fields are largely static between refresh cycles, which makes them reliable for territory design and quota-setting but slow to catch a fast-moving opportunity. Technographic fields shift in near real time as vendors get installed, upgraded, or removed, which makes them the better signal for timing a specific outreach. Understanding Technographics has a full side-by-side breakdown against demographic data as well, with example attributes and sales-signal strength for each. For a scoring model, though, the distinction that matters most is the one above: what stays fixed versus what needs constant refreshing to stay useful.
How firmographic and technographic data work together
Neither data type replaces the other. How to Use Firmographic Segmentation to Build a Winning B2B Strategy makes the broader case for layering technographic, spend, and intent data on top of a firmographic foundation. The mechanics of how that layering actually happens in practice come down to one thing: enrichment architecture.
Go back to that same group of 741 software publishers from earlier. Ninety percent run at least one Salesforce CRM product, and 83 percent run at least one HubSpot CRM product, and the overlap between those two groups means most of them run tools from both vendors rather than settling on one. A firmographic scoring model, built only on industry, size, and geography, has no way to see that. Technographic data does, and that’s exactly the kind of signal that makes layering the two worth the effort.
Why sequencing enrichment sources matters
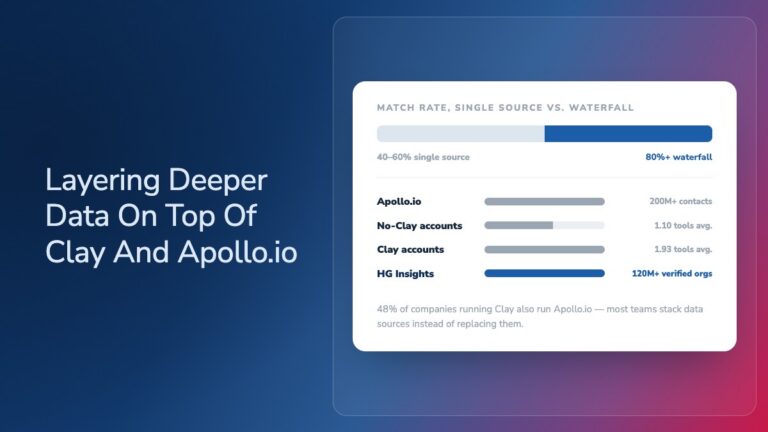
Most GTM teams no longer depend on a single vendor for both data types. Instead, they sequence multiple sources in a waterfall, prioritizing the most accurate and current field from whichever provider has it, then falling back to secondary sources when the primary one is stale or missing. Organizations using waterfall enrichment report match rates above 80 percent, compared with a 40 to 60 percent ceiling for single-source enrichment, according to industry research on B2B data architecture. That gap is the difference between a scoring model built on mostly complete records and one riddled with blanks that reps end up filling in by hand.
The sequencing matters as much as the data itself. Running technographic analysis before firmographic filtering wastes effort on accounts that were never a fit in the first place. Running firmographic filtering without technographic depth produces a list that is directionally right but tactically blind.
When to use firmographic data vs. technographic data
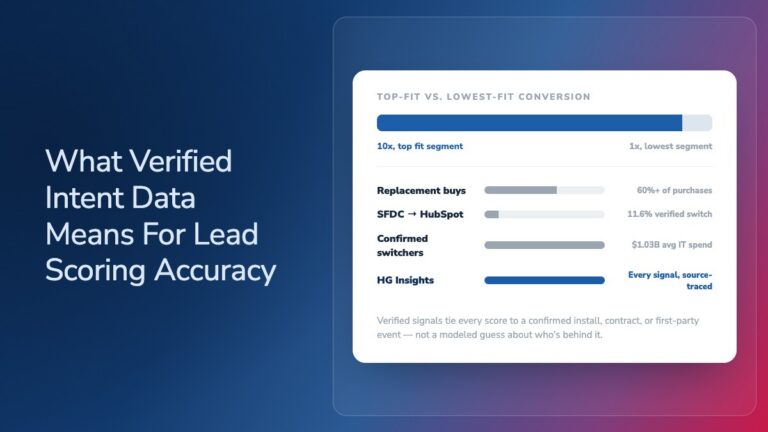
The right weighting between the two depends on what decision the data needs to support. Territory design and ICP qualification lean on firmographic data first, since they are fundamentally questions about which companies exist in a target market and how large the opportunity is. Competitive displacement, renewal timing, and technical fit scoring lean on technographic data first, since they depend on knowing what a specific account already runs. Organizations using technographic signals to identify accounts running a competitor’s platform report roughly three times higher conversion than traditional account-based outreach, and meaningfully higher churn-recovery rates on renewal campaigns, per GTM teams that have run competitive displacement campaigns using this approach. Most RevOps and data leadership teams end up building composite scores that weigh both, heavier on firmographic for top-of-funnel territory carving, heavier on technographic for active outbound and account-based plays.
Choosing a data vendor for both data types
Vendor selection matters at both ends, and it rarely makes sense to solve it twice. Teams evaluating firmographic providers should read B2B Firmographic Data Providers: How to Evaluate and Choose the Right One before signing a contract, since coverage and match-rate accuracy vary widely by provider. Teams building a displacement motion should look at Best Technographic Data Platforms for B2B Sales Teams in 2026 for a platform-by-platform breakdown. Increasingly, both evaluations converge on the same question: does this data have to come from separate vendors at all? HG Insights delivers firmographic, technographic, IT spend, and buyer intent data together through its RGI Fabric, built on a database spanning more than 120 million organizations and 20 billion external data points, so a scoring model pulls from one governed source instead of reconciling two or three.
Frequently Asked Questions
What does firmographic data mean?
Firmographic data means the organizational attributes used to classify and segment a business, including employee count, annual revenue, industry classification, headquarters location, and corporate structure. B2B teams use it to determine whether a company fits their ideal customer profile before evaluating any behavioral or technology signals.
What is technographic data?
Technographic data is verified information about the technology a company actually has installed, including specific software platforms, cloud infrastructure, and IT systems, along with signals like install dates and renewal timing. It reveals what tools a business runs today, not what it claims to use in marketing materials.
What is the difference between demographics and firmographic data?
Demographic data describes individual people: their job title, seniority, and department. Firmographic data describes the organization those people work for: its size, industry, and revenue. B2B teams combine both, using demographic data to find the right buyer and firmographic data to confirm the company is worth pursuing.
What does firmographic segmentation mean?
Firmographic segmentation means grouping accounts by shared organizational traits, such as industry, employee count, or geography, to prioritize outreach and tailor messaging. It is the B2B equivalent of demographic segmentation in consumer marketing, applied to companies rather than individuals, and it typically forms the first layer of any account-scoring model.