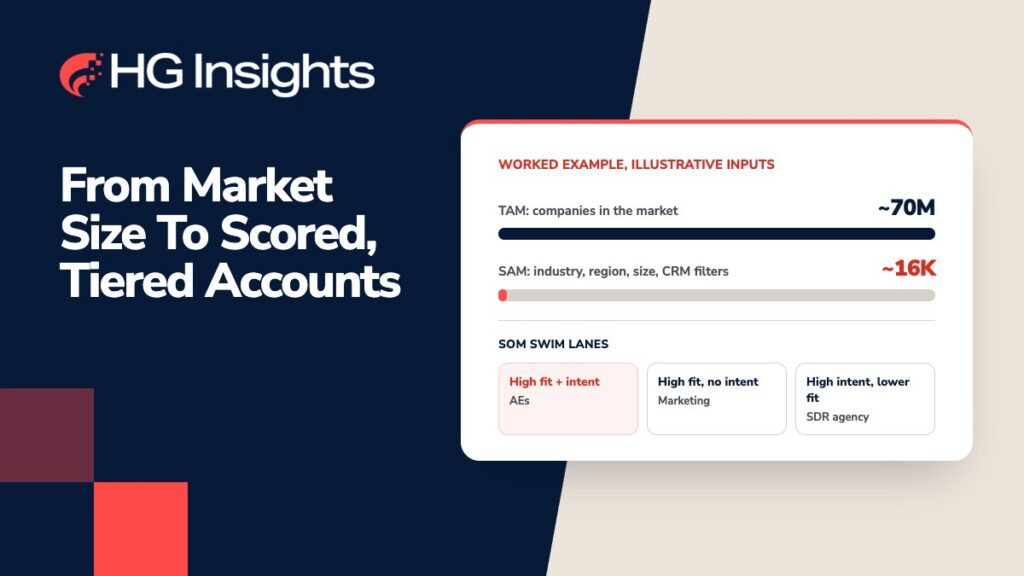
A TAM SAM SOM example shows its value when it ends in accounts a seller can act on. At Context26, HG Insights VP of Business Operations Spencer Hardey and Product Marketing Engineer Rachel Christopher walked through how HG Insights sizes its own market, scores the accounts inside it, assigns them to the right team, and executes in Sales Copilot, with a live demo at each step. This recap covers their breakout session.
Quick Answer: TAM is the total market, SAM is the slice a company can serve now given geography, infrastructure, product fit, and regulation, and SOM is the portion it scores and tiers based on capacity and budget. A worked example builds TAM from spend data, narrows to SAM with filters, and scores the SOM for fit, need, and intent.
Key takeaways
- Each tier needs its own filter. TAM, SAM, and SOM answer different questions, so each one narrows the market a different way.
- IT Spend sharpens TAM. It shows what share of an account’s budget a team can win and confirms an account belongs in the market.
- Scoring makes the SOM actionable. Fit, Need, and Intent turn a market list into tiers, and a visible model makes every score traceable.
- Swim lanes assign the work. High-fit, high-intent accounts go to AEs, high-fit accounts without intent go to marketing, and high-intent accounts with lower fit go to an SDR agency.
- Execution can start from the same list. Sales Copilot turns scored accounts into briefs and call prep in minutes, not hours.
What Spencer and Rachel showed at Context26
Spencer opened from a RevOps point of view, where one of his top priorities is driving alignment across the business. His session followed a single path: size the market, score and tier what is inside it, assign accounts to the right team, and execute. Rachel ran the demos in Market Analyzer, AI Scoring, and Sales Copilot. For definitions of each tier, read HG Insights’ complete guide to TAM, SAM, and SOM. To see the session itself, watch the Context26 recording.
TAM, SAM, and SOM: why each tier needs a different filter
Spencer’s point was that each tier answers a different question, so each needs different filters. Trying to market to every company in a total addressable market (TAM) brings diminishing returns, he said.
The next tier is the serviceable addressable market (SAM). It is the slice of TAM a company can serve right now, based on its infrastructure, the geographies it can sell to, the fit of its products and services, and regulations. Spencer said to map the SAM into the account list in the CRM, so a team can track engagement across the accounts it can serve in the next twelve months. For HG Insights, the move from TAM to SAM comes from focusing on specific geographies and regions.
The third tier is the serviceable obtainable market (SOM), where execution happens.
“Within your SAM, based on your capacity and your limited budget, you’re going to want to score and tier those accounts for territory assignment, outbound demand gen, and making clear swim lanes within sales, business development, and marketing.” – Spencer Hardey, VP of Business Operations, HG Insights
The rest of the session followed that sentence in order: build the TAM, narrow to SAM, score the SOM, assign swim lanes, and execute.
Building TAM with IT Spend and company descriptions instead of industry codes
Spencer described two common ways to build a TAM. The first is the traditional one: industry categorization and company size, by revenue or employees. In his experience, that is where many companies stop.
HG Insights customers get a more accurate TAM with IT Spend, he said. IT Spend shows what percentage of an individual account’s budget a team’s products and services can potentially win, which answers how much revenue the market is worth. It can also confirm that an account belongs in the addressable market. Teams then apply ICP or account scoring thresholds and account hierarchy, such as whether to focus on regional or global headquarters.
The second approach is the one HG Insights uses on itself. Because of AI and the pace of change in the technology market, Spencer said, HG Insights applies an LLM and an agent on top of its company descriptions. That aligns each account to the products and services it brings to market and checks whether they fit HG Insights’ own. It lets the team cut through noise in legacy industry classifications that have not kept up with technological change.
Narrowing to SAM by industry, region, employee count, and CRM integrations
Rachel then built a TAM, SAM, and SOM live in Market Analyzer, with Spencer supplying the inputs. She was clear that the numbers were a role play, so treat them as an example, not HG Insights’ actual model.
Spencer started with spend categories. For HG Insights, that means the sales and marketing spend a company makes and what it spends on analytics and business intelligence, using the IT Spend detail proprietary to HG Insights. He then assumed a share of each budget the company could win: 25% of sales and marketing spend and 15% of analytics and business intelligence. Rachel noted the spend number dipped as those percentages went in, while the company count stayed near 70 million and growing.
For SAM, the inputs were two industries, professional and scientific services and computer and electronic manufacturing, and two regions, North America and EMEA. Spencer said this mirrors what HG Insights does, which is adjusting its TAM to its SAM based on where it has sales teams ready to sell. He then set employee count at 200 or more and added Salesforce and HubSpot CRM integrations, as an example of targeting companies that connect to a specific product.
The result was about 16,000 companies. Rachel noted that Market Analyzer calculates the TAM, SAM, and SOM on demand from Tech Installs and IT Spend.
Spencer said the speed was the point, along with how defensible the list is when presented to a board or an investor. He also described how the work really goes.
“It’s the practice of drilling into the underlying companies, reviewing those, realizing you included something you shouldn’t have, and then going back and setting the filters.” – Spencer Hardey, VP of Business Operations, HG Insights
That iteration produces an accurate market, and in his words it drives alignment across the entire exec team.
“Ultimately, that drives alignment across the entire exec team on what you’re focused on.” – Spencer Hardey, VP of Business Operations, HG Insights
Scoring the SOM on fit, need, and intent across 13 use cases
With the market sized, Spencer moved to prioritization. HG Insights uses AI Scoring to score 13 use cases it serves across its products, and he said that was not something he could do before AI Scoring was available in the platform.
“The amount of time and legwork it would take to create 13 different unique scoring profiles for every account in my SOM was just not feasible.” – Spencer Hardey, VP of Business Operations, HG Insights
Teams can score in several ways. A company with a clear use case and persona might score by product. A company with a handful of offerings grouped for certain personas might score by offering. HG Insights has products that serve multiple use cases, so it scores by use case.
Whichever approach a team chooses, the model returns a view on three dimensions.
“The AI scoring model gives me very clear insight about three things, fit, need, and intent.” – Spencer Hardey, VP of Business Operations, HG Insights
Fit covers how well an account matches the ICP, including company size, industry, a maturity model built on complexity signals, and the percentage of budget spent on the categories a team sells into. Need covers how much a team can already tell the account needs the product: whether it uses a competitor, whether it is a displacement target, tech stack maturity and readiness, the content and research it is doing, and how its stack is changing over time. Intent covers whether the account is in a buying cycle right now, researching a team’s products or its competitors’, and showing late-stage buyer activity such as TrustRadius Buyer Intent.
Rachel then walked through the model itself. AI Scoring is not CRM dependent, and she described the starting point.
“The way that you get started with our scoring is just entering in your company’s domain, and that’s kinda all you need.” – Rachel Christopher, Product Marketing Engineer, HG Insights
From there, a team can score by offering or use case, so the scoring bends around its workflows instead of the other way around. Lookalike seeds can come from Market Analyzer segments, a pasted list, selected products, or an uploaded CSV.
She also showed one HG Insights scoring profile, which weights Fit at 50%, Need at 35%, and Intent at 15%. Every condition is visible. Companies under 99 employees earn zero points, for example, because they are too small to run a dedicated RevOps function that would buy a go-to-market intelligence platform. That is precision you can trace. Edits happen through a conversation inside the scoring module. Rachel asked it to add partner software to the scoring, and it made the change and explained what it changed and why. Earlier conversations and versions stay available, which helps when someone inherits a model.
Swim lanes: who gets high-fit, high-intent accounts
Spencer described three swim lanes, built on the Fit and Intent scores.
“High fit, high intent, we give all those accounts to our AEs.” – Spencer Hardey, VP of Business Operations, HG Insights
Those accounts are handheld and engaged immediately by the best sellers. HG Insights tiers them with the scoring methodology so AE territories are equitable and optimized. Accounts with high fit and no intent go to marketing, which develops intent and then hands the accounts to AEs. Accounts with strong intent but not a traditional high fit go to HG Insights’ SDR agency, which researches, engages, and books meetings. If those convert and prove to be a good fit, that feeds back into the scoring model as a change to make.
Executing in Sales Copilot with account briefs and call prep
Execution starts with the use case. For each account in its top A and B tiers, HG Insights has prioritized the use case to lead with, the one where that account’s fit, need, and intent are highest. Across the SOM, it also looks at which use cases are surging, and uses that to decide where to put demand generation budget and effort first.
Next, Spencer said, the team identifies the buyer personas, decision makers and champions, that fit each use case, and uses use case scoring to find which people and accounts are surging. It enriches those contacts, launches campaigns, and makes the follow-up plays clear for sellers in Sales Copilot, where engagement with the campaign, job changes and new hires, and intent signals are centralized. Every campaign leads with an offer of value aligned to the use case.
Rachel showed the flow. In Market Analyzer, she saved the SOM as a segment, added the scoring profile, filtered to A and B accounts with a score above 70, and opened the list in Sales Copilot. There, an account agent asks for the purpose, audience, and depth of a brief. She chose a follow-up call prep for an AE at medium depth. The result combined strategic context, Tech Installs and IT Spend, a summary of the account’s Fit, Need, and Intent scores, who to engage, talking points, objections, questions to ask, and how to advance the call. Rachel’s summary was that this replaces hours of account research with minutes.
Spencer closed by tying the session together: one platform, combining a team’s first-party context with the Contextual Intelligence in Fabric.
Watch the full session
This recap covers Spencer and Rachel’s breakout. Watch the full Context26 recording to see the sizing, scoring, and Sales Copilot demos. To see how it connects, visit the Contextual Intelligence Platform page, or book a demo of Market Analyzer.
Frequently Asked Questions
What is the difference between TAM, SAM, and SOM?
TAM is the total market. SAM is the slice a company can serve now, based on its infrastructure, the geographies it can sell to, its product market fit, and regulations. SOM is the portion a team scores and tiers for execution, based on its capacity and budget, so effort goes to the accounts it can realistically work.
How do you build a TAM with IT spend?
IT Spend shows what share of an account’s budget a product can potentially win, which makes a market’s revenue potential clearer than industry and company size alone. It can also confirm an account belongs in the addressable market. Teams then apply ICP or account scoring thresholds and account hierarchy, such as regional or global headquarters.
How should you prioritize accounts after sizing a market?
Score and tier the accounts, then assign swim lanes. At its Context26 event, HG Insights shared this example: high-fit, high-intent accounts go to AEs. High-fit accounts without intent go to marketing to build intent. High-intent accounts with lower fit go to an SDR agency. Conversions feed back into the scoring model.
What goes into an AI account scoring model?
AI Scoring models combine Fit, Need, and Intent. Fit covers company size, industry, maturity, and share of budget spent on relevant categories. Need covers competitor use, tech stack maturity, research, and change over time. Intent covers active buying cycles and late-stage buyer activity.
How fast can you size a market and get to an account list?
Quickly, because the TAM, SAM, and SOM calculate on demand as filters are applied. During its Context26 event, HG Insights demonstrated filtering by spend share, industry, region, employee count, and CRM integrations to reach about 16,000 companies, then saving the list as a segment, scoring it, and opening it in Sales Copilot. The inputs were illustrative.
Author
-

Nik Koutsoukos brings over 25 years of product and marketing executive leadership to his role as VP of Product Marketing at HG Insights. He drives product GTM, customer and partner-marketing, and sales enablement to increase awareness, reach, adoption, and growth.
Prior to HG Insights, Nik held senior positions including VP of Product Marketing at SolarWinds, Chief Marketing Officer at Catchpoint, and VP of Product Marketing at Riverbed Technology, where he helped scale adoption of enterprise performance and observability solutions. Nik brings deep expertise in translating complex technology into compelling market value and partner-aligned growth. He holds a BSEE from Leeds Beckett University.