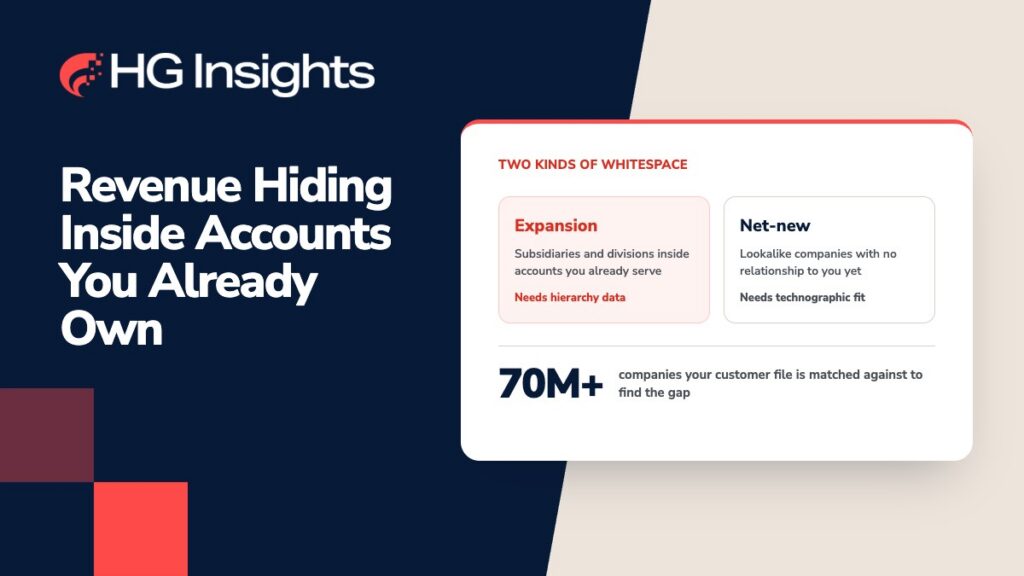
Somewhere inside your current customer base, there’s a division, a subsidiary, a regional office, or a new business unit that was recently created that your team has never called on. That’s not because your reps don’t want the business. It is because nobody’s target account list shows these opportunities. Whitespace analysis is built to solve this: using technographic, spend, and corporate hierarchy data to surface expansion opportunities hiding inside accounts you already own, not just net-new logos you haven’t met yet.
Quick Answer: Whitespace analysis is the practice of identifying untapped revenue opportunities, both expansion within existing customers and net-new accounts, by mapping winnable lookalike ICP such as technology install data, IT spend, and corporate structure. It replaces manual, CRM-based account research with a data-driven view of where you’re already present and where you’re not.
The Gap Spreadsheets Can’t Close
Most RevOps teams already believe in whitespace. Nobody needs convincing that expansion revenue exists inside accounts they already serve. The problem shows up earlier, in how the account list got built in the first place.
An account list in the spreadsheet reflects whoever last updated it and whatever CRM fields are populated at the time. It rarely reflects the actual legal and operational structure of the companies on it: the subsidiaries that got folded in during an acquisition, the regional office that runs its own P&L, the business unit that became a target account after the list was last touched. None of that shows up until someone manually goes looking, and manual research doesn’t scale past a handful of strategic accounts.
So the list goes stale. A rep is targeting the parent company headquarters while a wholly-owned subsidiary three layers down is already buying the category of software your company sells, from a competitor, with its own budget and buying committee. It’s a visibility gap, and it’s the one most teams bring into a new tool evaluation without realizing it.
Why Account Hierarchy Is the Foundation of Whitespace Analysis
Whitespace analysis depends on knowing what a company actually looks like underneath its logo. A framework built on technographic and spend data is only as good as the account structure it’s mapped against, and that structure has several layers.
Corporate hierarchy and subsidiary mapping
This is the layer most tools skip or oversimplify. Corporate hierarchy data traces parent-child relationships: which subsidiaries roll up to which parent, which divisions operate independently, which acquisitions changed the structure in the last year. Without it, “account coverage” is really just “coverage of whatever entity happens to carry the parent company’s name.”
Technographic and IT spend data
Once the hierarchy is mapped, the question becomes what each entity in it is actually running and spending. Technology install data shows which subsidiaries use competing products, which are unserved, and which have budget allocated to the category. This is what separates a real opportunity from a guess.
Customer data matching
A whitespace model needs to know precisely which parts of a corporate family are already customers and which aren’t. Matching an uploaded customer list against a broader account hierarchy distinguishes an expansion prospect, a division of a company you already serve, from a net-new logo with no relationship to your business. Keep these two separated because combining the two is how pipeline gets misattributed and forecasts get muddy.
Competitive velocity tracking
Hierarchy and spend data answer where the whitespace is. Competitive install tracking answers how urgent it is. If a competitor is gaining ground inside a subsidiary that hasn’t shown up on anyone’s radar, that whitespace has a shelf life, and the account team needs to know before the opportunity closes somewhere else.
Lookalike modeling for net-new prospects
You can point these same four layers outward instead of inward. Once a model knows the technographic and spend signature of your best current customers, it can score the rest of the market against that signature, surfacing net-new companies that have never engaged with your business but structurally resemble the accounts already converting. That’s whitespace analysis applied to acquisition, not just expansion.
Put together, these five pieces turn whitespace analysis from a slide in a strategy deck into something a RevOps team can operationalize: a live, structured view of exactly which parts of which accounts are open, contested, or already won and which net-new accounts outside it are worth a first call..
How Whitespace Analysis Drives Alignment Across GTM Teams
RevOps owns the account list, which means RevOps owns the consequences when that list is wrong. A hierarchy-aware whitespace model gives RevOps a single structure that territory assignments, quota models, and account ownership can all point back to, instead of each team maintaining its own partial view of the same companies.
Sales gets a different benefit. A rep working a known logo stops guessing whether an unfamiliar subsidiary name belongs to their existing account or someone else’s territory.
Marketing uses the same structure to stop treating a parent company and its subsidiaries as one account target. Campaigns built for the true account structure can reach the division that’s actually in-market, rather than spraying messaging at a corporate headquarters that has no budget authority over the unit that needs the product.
Strategy and leadership get the roll-up view: how much of the addressable market inside the current customer base is genuinely penetrated, and how much is still whitespace. That number is hard to produce by hand and easy to get wrong when subsidiaries aren’t mapped correctly, which is why it’s often an estimate rather than an accurate list.
What Is Whitespace Analysis in B2B Sales?
Whitespace analysis in B2B sales identifies underserved revenue opportunities within current customer accounts and finds net-new lookalike accounts that match winning technology usage data, spend data, and corporate structure. Rather than relying on CRM fields or sales intuition, it uses verified external data to show precisely where a company is present, absent, or facing competitive pressure.
The term gets used loosely to mean “untapped market,” but the more precise version matters for RevOps: whitespace splits cleanly into two categories.
- Expansion whitespace sits inside accounts already in your customer base, subsidiaries, divisions, or business units that aren’t yet buying from you.
- Net-new whitespace sits outside your customer base entirely, in companies that match your ideal customer profile but have no relationship with you at all. That match isn’t a generic firmographic filter such as industry, employee count, or revenue band. It’s a lookalike score built from the technographic and spend signature of your current best customers, which is what separates a true net-new whitespace account from an ordinary prospect list.
Combining the two is the single most common reason whitespace numbers get disputed in planning meetings, because a rep closing a subsidiary of an existing customer and a rep closing a true net-new logo are solving different problems with different sales motions.
Where Whitespace Evaluations Actually Stall
The strategic case for whitespace analysis is usually settled before a tool evaluation even starts. What stalls adoption is three operational concerns –
- The first is account list lock-in. Teams running tight, attributed account lists worry that a new data layer will blur the boundaries they’ve built their reporting around, introducing leads or accounts outside the defined set that can’t be cleanly credited to a campaign or a quota.
- The second is integration complexity: whether a new system will actually sync with the CRM and marketing automation tools already in place, or whether it becomes one more disconnected dashboard nobody checks.
- The third, and often the deciding one, is trust in data and hierarchy. A RevOps leader who has been burned by bad account data once is reluctant to hand a sales team a new list without confidence that the underlying hierarchy is accurate.
Each of these is really a question about whether a specific implementation can be trusted and absorbed without disrupting what already works. One growth-stage B2B company replaced its manually built account list with hierarchy-aware data and found meaningful expansion revenue sitting inside subsidiaries and divisions that the spreadsheet had never surfaced. That pattern is common enough across growth-segment teams.
Find Expansion Revenue with HG Insights Market Analyzer
HG Insights built Whitespace Analysis into Market Analyzer to solve these operational concerns around data refresh and finding untapped market. From day one, it gives RevOps teams hierarchy-aware visibility into subsidiary- and division-level account structure, replacing the manual mapping most teams have done by hand.
Market Analyzer runs on HG Fabric, the data foundation behind technographics, IT spend, firmographics, and corporate hierarchy mapping. Define your total addressable market, upload your customer list, and Market Analyzer matches it against a verified account hierarchy, separating real expansion prospects from net-new accounts and from accounts that were never actually in scope. It also runs in reverse: scoring the market against your best customers’ technographic and spend profile to surface net-new, lookalike accounts you’ve never touched. See how HG Insights helps RevOps teams quantify whitespace against account hierarchy they can actually trust.
Start with the Accounts You Already Have
The expansion revenue inside your account hierarchy is real. It’s sitting in subsidiaries and divisions that never made it onto a spreadsheet, waiting for someone with the right data to notice them before a competitor does. See how HG Insights Market Analyzer maps your account hierarchy and surfaces the whitespace your current list can’t show you.
Frequently Asked Questions
What is whitespace analysis in B2B sales?
Whitespace analysis identifies under-served revenue opportunities by combining technology usage, IT spend, and corporate hierarchy data. It covers both expansion whitespace inside existing customer accounts and net-new whitespace in companies outside the current customer base.
How is expansion whitespace different from net-new whitespace?
Expansion whitespace exists inside accounts your company already serves, typically in subsidiaries or divisions that aren’t yet customers. Net-new whitespace exists in companies with no current relationship to your business at all. The two require different sales motions and should be tracked separately.
Why do whitespace analysis tool evaluations stall?
Evaluations rarely stall over disagreement that whitespace matters strategically. They stall on operational concerns: account list lock-in and attribution rules, integration complexity with existing CRM and marketing systems, and trust in the underlying hierarchy data before it reaches a sales team.
What data does whitespace analysis depend on?
It depends on accurate corporate hierarchy and subsidiary mapping; technographic and IT spend data showing what each entity uses and spends; customer list matching to distinguish expansion from net-new accounts; and competitive install tracking to flag how urgent an opportunity is.
Can whitespace analysis replace our existing intent or account intelligence tools?
No, and it isn’t designed to. Growth-segment teams typically run whitespace and hierarchy data alongside existing intent platforms, using it to fill gaps in account structure and spend visibility that those tools weren’t built to cover.
What ROI can we expect from whitespace analysis?
Whitespace analysis delivers value in four measurable areas: expansion pipeline from accounts you already serve, net-new pipeline from unpenetrated segments, reduced overlap among teams working the same accounts, and analyst hours recovered from manual market research. HG Insights maps your customer file against a database of more than 70 million companies, then classifies the remaining gap into expansion whitespace tied to existing account hierarchies and prospect whitespace with no current relationship. That split drives most of the return because expansion plays and net-new pursuits have different conversion rates and different costs to serve.
How does HG Insights identify whitespace opportunities?
HG combines your customer data with its proprietary database of 70M+ companies and technology intelligence to identify which organizations in your market are not yet customers. The Market Analyzer automatically excludes matched customer accounts and surfaces the remaining companies as whitespace. You can also segment whitespace into expansion (related to existing customers) and prospect whitespace (completely new entities). This helps your team focus efforts based on growth potential and relationship maturity.