Technographic data accuracy is impossible to judge from a spec sheet. Every vendor claims broad coverage and high match rates, but coverage numbers say nothing about whether an install record reflects what a company is running today or what it ran fourteen months ago. Buyers evaluating a technographic or enrichment vendor need to see the validation process itself, not just the output. This piece walks through how HG Insights verifies and refreshes install data, and what the benchmarks show across segments and regions.
Quick answer: Technographic data accuracy depends on three things: how recently an install was verified, how strong the underlying detection signal is, and how matches are resolved across corporate hierarchies. The single most useful number a vendor can show you, including HG Insights, is the last-verified date on a record, not a blended match-rate or coverage claim. HG Insights attaches a last-verified date and an intensity score to every install instead of a flat “installed” flag.
Why technographic data accuracy is hard to verify from the outside
Every technographic vendor will tell you their data is accurate. Almost none will show you how they define the word. A prospect list, a CRM enrichment feed, or a competitor-install report all look identical on a dashboard, whether the underlying tool was confirmed running yesterday or flagged fourteen months ago and never checked again. The install field just says installed.
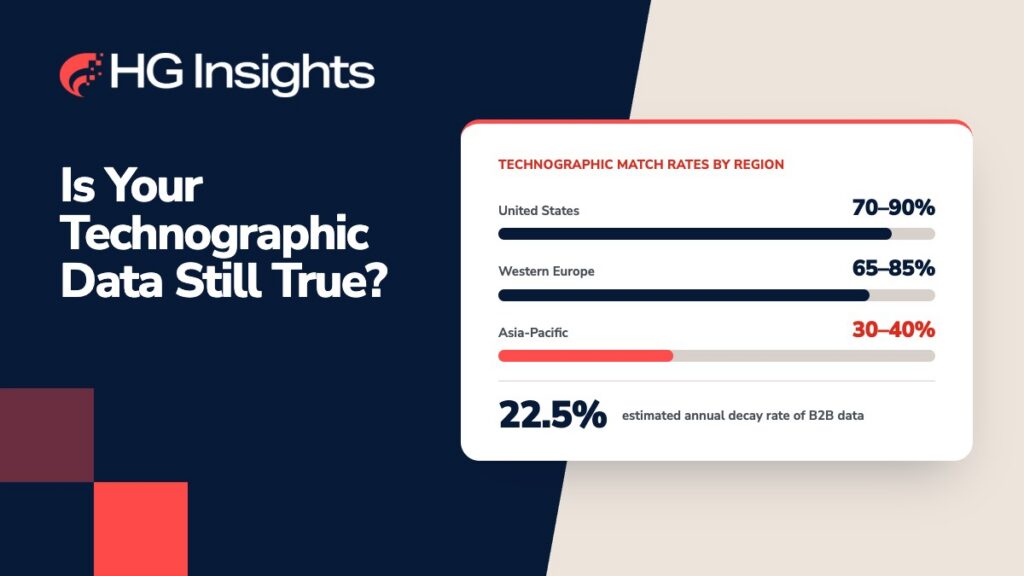
That’s the core problem: accuracy claims are unfalsifiable from the outside unless a vendor exposes its methodology. Technology stacks change constantly. Contracts renew, cloud migrations happen, tools get consolidated after mergers, and B2B data decays at an estimated annual rate of about 22.5 percent, according to research cited by HubSpot. A provider updating quarterly and a provider re-verifying far more often can both report a 75 percent match rate on paper. Only one of those numbers reflects what’s actually deployed right now.
HG Insights’ own data shows exactly how wide that gap can get. In the Customer Relationship Management Applications category alone, HG Insights tracks install records for 3.2 million companies, but only 46 percent of those installs have been re-verified in the past 90 days. The rest may still be accurate, but there’s no way to know without checking the last-verified date on each record, and a flat “installed” flag doesn’t show it.
Buyers usually find out which is which after the fact, when a rep references a platform an account replaced last year, or when a scoring model built on stale installs sends outreach to accounts that already switched vendors. The accuracy question has to be answered before that point, not after.
Why a single “installed” flag can’t tell you what you need to know
Ask a vendor one question before you trust their coverage number: for any single record, can you see when it was last verified? That’s the most direct answer to how accurate technographic data actually is. Accuracy depends on what a vendor discloses about detection signal and last-verified date, not on the size of its database or the volume of records it claims to hold.
A record verified last week and a record verified fourteen months ago can sit in the same feed carrying the exact same “installed” label. Only the last-verified date tells them apart, and most vendors don’t expose it at the record level at all, only as an aggregate claim like “95 percent match rate” or “refreshed quarterly.” That aggregate number says nothing about any specific account on your list, which is why two vendors with similar headline coverage numbers can produce very different outreach results in practice.
HG Insights attaches a last-verified date and an intensity score to every install it tracks, so a team can check both before acting on a record: when it was last confirmed, and how strong the underlying signal is. That’s a meaningfully different standard than a single blended accuracy number, because it lets a team decide for themselves whether a given account is safe to act on now or worth re-checking first, on HG’s data as much as anyone else’s.
Our validation methodology: detection, hierarchy resolution, and auditability
Detection draws on multiple real-world signals, including job postings and other public usage indicators, rather than a single source. Every record carries a last-verified date and an intensity score, so a team can see not just what was detected, but when it was last checked and how strong the signal is.
Stale data and fresh data can look identical in a flat feed; only the last-verified date tells them apart. For accounts with complex ownership structures, subsidiaries, regional entities, recent M&A activity, matching accuracy comes down to hierarchy resolution: correctly anchoring a domain to its parent entity and reconciling records at the country level so a subsidiary’s install doesn’t get lost or double-counted. One enterprise technology company that came to HG Insights after years with a previous vendor had a match rate of 43 percent. Through iterative work on hierarchy matching, domain anchoring, and country-level reconciliation, that number reached 89 percent, on the same accounts, the same markets, and the same sales team. (For the fuller story on what low-cost data misses in the first place, see why low-cost technographic data can undermine GTM performance.)
Auditable, inspectable scoring
Every score HG Insights produces is also auditable. A data team can trace any account score back to the specific install, spend, or intent signals that drove it, adjust the weighting, or override a result outright. That transparency is deliberate: teams that can’t inspect a scoring model stop trusting it, and a model nobody trusts doesn’t get used, no matter how accurate it actually is. That’s not a hypothetical: only 35 percent of sales professionals say they fully trust their organization’s data, according to Gartner. That level of detail is what Fabric exposes at the API level, so a data team can pull install records with their intensity scores and last-verified dates directly into their own systems instead of trusting a dashboard number.
Accuracy benchmarks by segment and region
Published research on international data coverage puts U.S. technographic match rates in the 70 to 90 percent range. Western Europe runs lower, typically 65 to 85 percent, a gap mostly attributable to GDPR consent requirements that limit what can be collected and matched. Asia-Pacific trails further still, in the 30 to 40 percent range, a product of fragmented local data sources and inconsistent regulatory access across markets. Any vendor quoting a single global match rate is averaging over that spread, which hides exactly the regional weak points a global GTM team needs to plan around.
Architecture matters as much as geography. Single-source technographic data tends to plateau in the 40 to 60 percent match rate range. Waterfall approaches that sequence multiple sources, resolving conflicts and filling gaps as they go, push past 80 percent.
Segment complexity adds a third variable. Enterprise accounts with multiple subsidiaries, recent acquisitions, or decentralized regional operations start from a meaningfully lower baseline than a flat mid-market company, simply because there are more parent-child relationships to resolve correctly. That’s a matching-methodology problem more than a coverage problem, and it’s why hierarchy resolution comes up so often in vendor evaluations for larger, more complex organizations.
What match rate actually measures (and what it misses)
Match rate answers one question: out of a target account list, what percentage came back with a resolved record instead of a blank. It says nothing about what’s inside that record. A vendor can report an 85 percent match rate while a third of those matches haven’t been re-verified in over a year, or worse, were never specifically confirmed at all. Two providers can publish the same headline number and deliver very different accuracy in practice, because match rate measures coverage, not confidence.
That gap matters most in market sizing. A TAM model built on match-rate coverage alone inherits whatever mix of recently verified and long-stale records sits underneath it, which is exactly how static models built from firmographic proxies, industry code and employee count, routinely overcount or undercount a segment. Market Analyzer builds TAM using verified install data alongside firmographic and spend signals, rather than firmographic proxies alone, so the segments a team prioritizes better reflect how companies actually buy.
A useful accuracy conversation asks for the breakdown behind the match rate: what share of those matches have been verified in the past quarter, and how old is the oldest last-verified date in the file. That breakdown is the number that actually predicts whether a campaign built on the data will work.
How to ask any vendor to prove their accuracy claims
Accuracy claims are only as good as the questions asked before signing. A useful evaluation asks a vendor what share of their coverage has been verified recently, not just the aggregate match-rate number. It asks how often records get re-verified, and asks to see the actual last-verified dates rather than taking a cadence claim on faith. It asks how the vendor resolves corporate hierarchies, parent companies, subsidiaries, recent acquisitions, since that’s usually where match rate breaks down for larger accounts. And it asks whether the scoring methodology is auditable, so a data team can see exactly which signals drove a given score instead of trusting a black box.
That breakdown matters because currency swings wildly by category, even inside the same vendor’s catalog. HG Insights’ own install base shows 65 percent of endpoint security installs re-verified in the last 90 days, compared with 46 percent for CRM and just 21 percent for HR and workforce management systems. A vendor quoting one blended accuracy number across their whole catalog is averaging over a spread that size, which is exactly why the breakdown has to be specific to the category a buyer actually cares about.
The fastest way to get real answers to those questions is to ask for a benchmark against data already in place. A vendor confident in its validation process should be willing to run a comparison, match rate, currency, and hierarchy resolution, against the provider currently in use, before any contract changes. Talk to HG Insights about a benchmark comparison and see what verified detection actually turns up in your own account list.
Frequently Asked Questions
What is technographic data accuracy?
Technographic data accuracy measures whether an install record reflects what a company is actually running, not just whether a match exists in a database. It depends on detection signal, last-verified date, and hierarchy resolution rather than raw coverage numbers, since a high match rate can still include records that haven’t been checked in a long time.
How does HG Insights validate technographic data?
HG Insights detects installs from multiple real-world signals, including job postings and other public usage indicators, and attaches a last-verified date and an intensity score to every record. That combination lets a team judge for themselves whether an install is still accurate or worth re-checking, rather than relying on a flat “installed” label, and hierarchy matching resolves parent-child relationships so subsidiary installs are correctly attributed.
What is a good match rate for technographic data?
A strong match rate typically falls above 80 percent in the U.S. market, achieved through waterfall architectures that sequence multiple data sources. Single-source vendors usually plateau between 40 and 60 percent. Match rate alone isn’t sufficient, though; the more important question is what share of matched records have actually been verified recently.
What does "last-verified date" mean for technographic data?
A last-verified date is the most recent point at which a vendor confirmed an install was still active, as opposed to when it was first detected. A record verified last week and a record verified over a year ago can carry the same flat “installed” label, so the last-verified date is what actually tells a team whether to trust it today.
Why does technographic data accuracy vary by region?
Match rates vary because data availability and regulation differ by market. U.S. technographic data typically runs 70 to 90 percent accurate, Western Europe trails at 65 to 85 percent due to GDPR consent restrictions, and Asia-Pacific lags further at 30 to 40 percent because of fragmented local sources and inconsistent regulatory access.
How often should technographic data be refreshed?
Technology stacks change constantly, and B2B data decays at roughly 22.5 percent annually, so infrequent refresh cycles quickly produce stale records that look identical to current ones. The right cadence varies by vendor; ask for their specific re-verification timeline and compare it against the last-verified dates you actually see in a sample of their data.
Author
-

Nik Koutsoukos brings over 25 years of product and marketing executive leadership to his role as VP of Product Marketing at HG Insights. He drives product GTM, customer and partner-marketing, and sales enablement to increase awareness, reach, adoption, and growth.
Prior to HG Insights, Nik held senior positions including VP of Product Marketing at SolarWinds, Chief Marketing Officer at Catchpoint, and VP of Product Marketing at Riverbed Technology, where he helped scale adoption of enterprise performance and observability solutions. Nik brings deep expertise in translating complex technology into compelling market value and partner-aligned growth. He holds a BSEE from Leeds Beckett University.