According to the data in HG Insights’ latest report, global IT spending will total $3.8 trillion in the next 12 months. Our data identified 4.2 million businesses buying IT services, software, hardware, and communications worldwide. The forecast period for this report is from July, 2024 to July, 2025.
This latest forecast illustrates the resilience of the IT market into 2025 and beyond. The data also surfaced several trends impacting the tech industry, including the rise of artificial intelligence and associated products like data centers, growth in software and services, and the impact of macroeconomic variables.
Here are some high-level takeaways from the report:
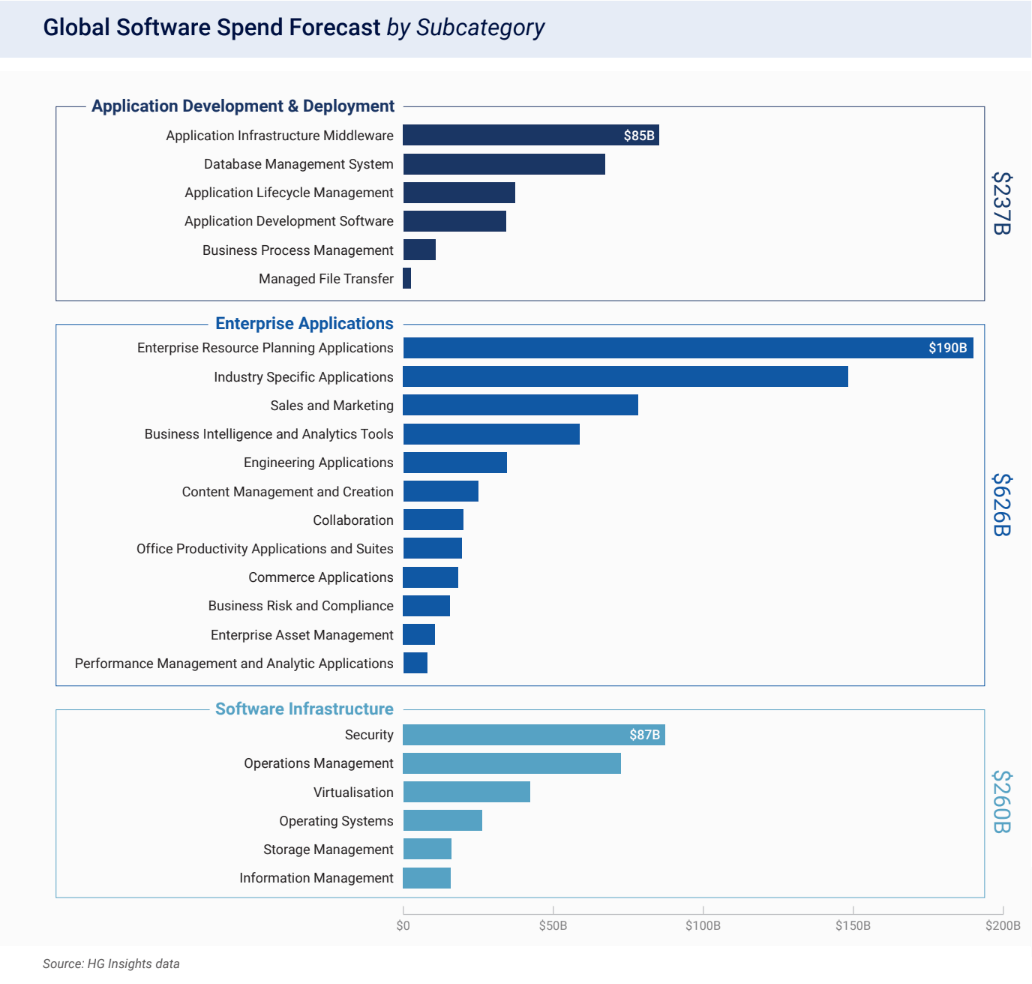
- IT software will reach $1.1 trillion in spend, with the Application Infrastructure Middleware, ERP Applications, and Security segments experiencing significant investment
- IT services is projected to hit $1.7 trillion, with notable growth rates in the Cloud Services, Application Led Outsourcing, and IT Consulting segments
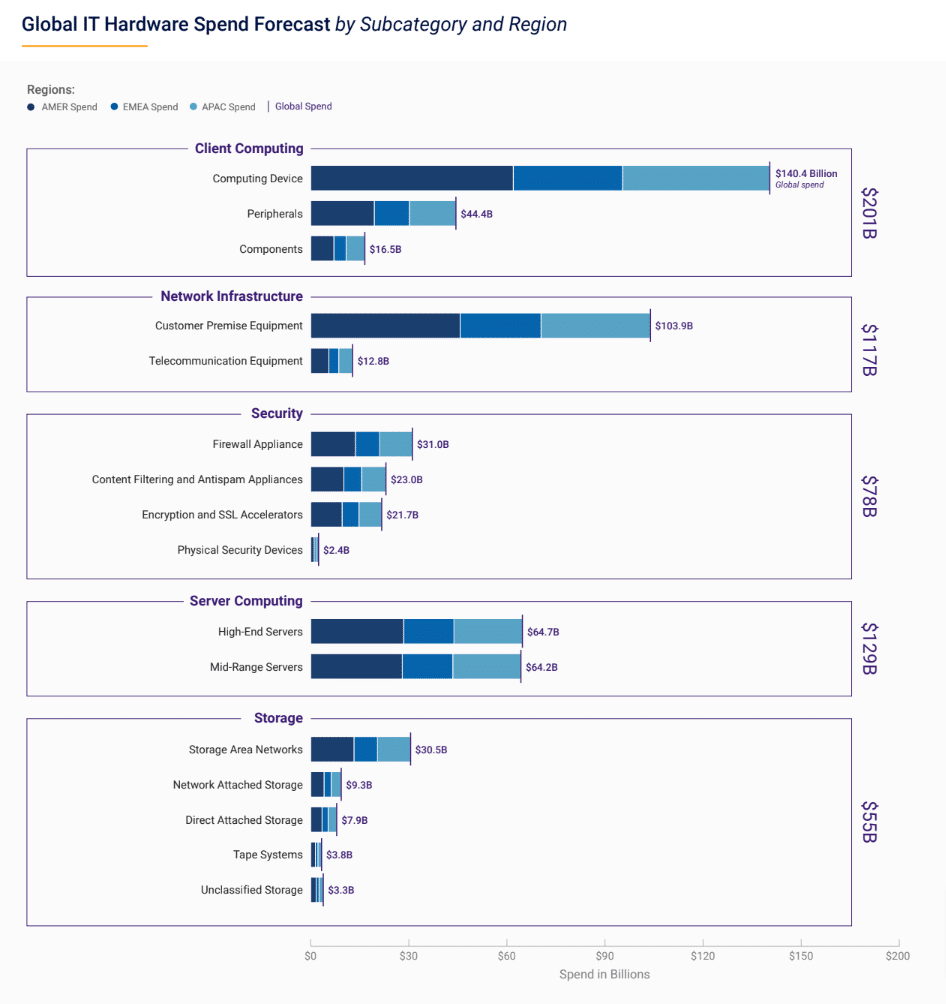
- The IT hardware market is expected to reach $579.7 billion, with Client Computing, Server Computing, and Network Infrastructure as the largest categories
- IT communications spending is projected to exceed $404.8 billion, primarily driven by Mobile Services and Fixed Data
This article provides an overview of spending across IT services, software, hardware, and communications and the trends impacting the IT market in 2025. To see the complete forecast for all 128 categories of IT, including top vendors and regions, download the IT Spend Report: The Ultimate B2B Market Forecast –>
Worldwide IT Spend Market Forecast
HG has identified 4.2 million businesses buying IT, with a total value of $3.8 trillion – a 3.8% year-over-year (YoY) increase globally. Gartner forecasts that global IT spend will grow by 8% to cross the $5 trillion threshold in 2024; however, that value includes Consumer spend, explaining the difference from HG Insights’ Enterprise-only spend forecast.
IT Spending by Region
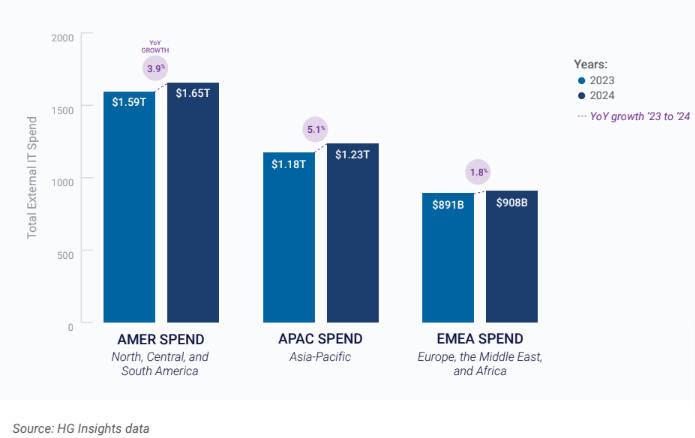
According to HG’s data, the regions of the United States, Central, and South America (AMER) and Asia-Pacific (APAC) will each surpass the $1 trillion mark, with $1.7 trillion and $1.2 trillion in projected spend over the next 12 months. Europe, the Middle East, and Africa (EMEA) is nearing this landmark as well, with $908 billion in forecasted spend.
Global IT Spending by Category
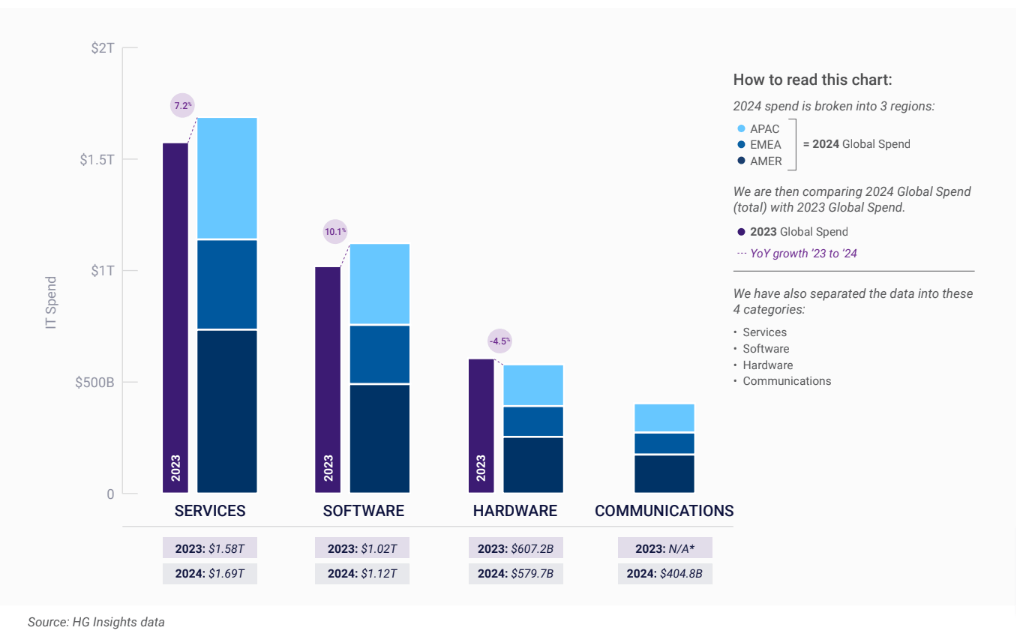
The projected YoY growth rates are largely thanks to the growth in IT services and software, each of which is larger than the two smaller categories combined. These two categories are projected to see significant IT spending growth compared to the previous 12 months, with IT services expected to increase by 7.2% and software by 10.1% year-over-year.
Across all four categories, AMER is the largest region by spend, accounting for between 43% and 44% in each category.
Trends Impacting the IT Market
Generative AI
The global shift of the tech industry toward Generative AI (GenAI) products since the launch of ChatGPT at the end of 2022 has continued. Forecasts for the size of the AI market range widely, but research by Bloomberg, Marketsandmarkets, and others project the GenAI market size will surpass $1.3 trillion by 2030. PwC estimates that AI could contribute $15.7 trillion to the global economy by 2030, more than the current combined output of China and India.
What is becoming clear is the impact that AI is having on associated products and services. For example, building out emerging technologies like new AI products, services, and use cases requires greater spending on data center systems, which we’re seeing play out in real-time: Gartner saw 10% growth year-over-year in data center spending. “There is also gold rush level spending by service providers in markets supporting large scale GenAI projects, such as servers and semiconductors,” says John-David Lovelock, distinguished vp analyst at Gartner.
Growth in IT Software and Services
HG’s data indicates strong growth in IT software and services (see previous page), accounting for much of the overall YoY growth in IT spend. While IT services is already the largest of the four categories covered in this report, its strong projected growth is largely due to a widening skills gap between Enterprise organizations and IT service firms. “This creates a greater need for investment in consulting spend compared to internal staff,” says Lovelock.
Macroeconomic Variables
The tech industry faced continued headwinds in 2023, with weakened global spending on tech and an uptick in layoffs. But this started to shift in 2024. As Deloitte’s technology industry outlook notes, “There are now glimmers of hope that a tech comeback may be imminent: Economists have lowered their assessments of recession risk, and analysts are optimistic that the tech sector could return to modest growth in 2024.”
At the same time, the upcoming US election could have an impact on this trajectory. Election years bring a period of uncertainty and potential change for the tech industry. Companies must remain agile, anticipating and adapting to new regulations, economic policies, and shifts in public sentiment to navigate these changes effectively.
IT Software Spend Forecast
According to HG’s data, total spend on IT software is projected to reach $1.1 trillion, a 10.1% YoY increase. This makes it the fastest-growing of the four categories covered in this report.
We break Software down into three categories and their subcategories: Applications Development and Deployment, Enterprise Applications, and Software Infrastructure. The following chart shows IT software spending by category and subcategory.
IT Services Spend Forecast
Global spending on IT services will reach $1.7 trillion in the next 12 months, an increase of $113 billion (7.2%) versus 2023. IT services is the largest of the four IT categories discussed in this report, accounting for 44.5% of all IT spend.
Gartner – whose projections show IT services growing by 9.7% to $1.52 trillion – says the category “is on pace to become the largest market that Gartner tracks.”
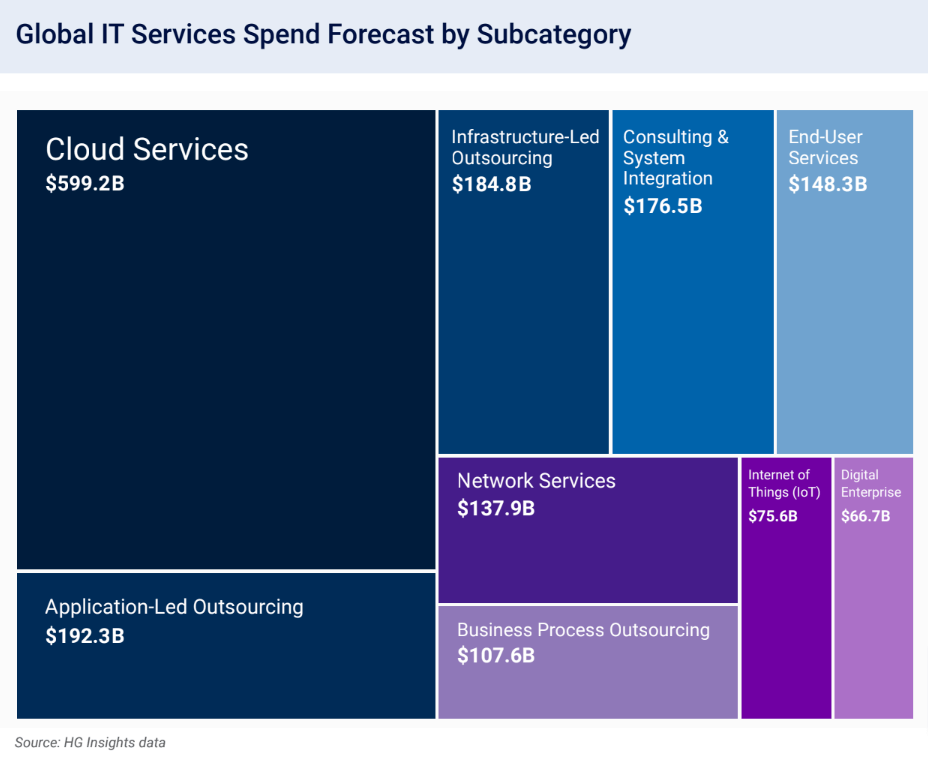
Cloud Services, which captures more than one-third (35.5%) of all IT Services spending, includes all of the subcategories using the “as-a-service” model. This means use of a product is offered as a subscription-based service rather than something the customer owns and maintains themselves.
The AMER region invests the most in Cloud Computing Services – $256 billion – making up about 42.7% of all global spend. APAC and EMEA account for 34.1% and 23.2%, respectively.
IT Hardware Spend Forecast
Worldwide spending on IT Hardware will reach $579.7 billion in 2025, a slight YoY decrease of -4.5%. AMER is the largest region, capturing 43.9% of the total.
We break IT Hardware down into five categories: Client Computing, Network Infrastructure, Security, Server Computing, and Storage. The chart below shows the Hardware spend forecast broken down by category, subcategory, and region:
IT Communications Spend Forecast
While Communications is the smallest of the four IT categories, it is still projected to reach over $404.8 billion in global IT spending over the next 12 months.
We break Communications services down into 4 categories: Fixed Data, Fixed Voice, Mobile Services, and Satellite Communications Services. The chart below shows Communications spending broken down by subcategory and region:
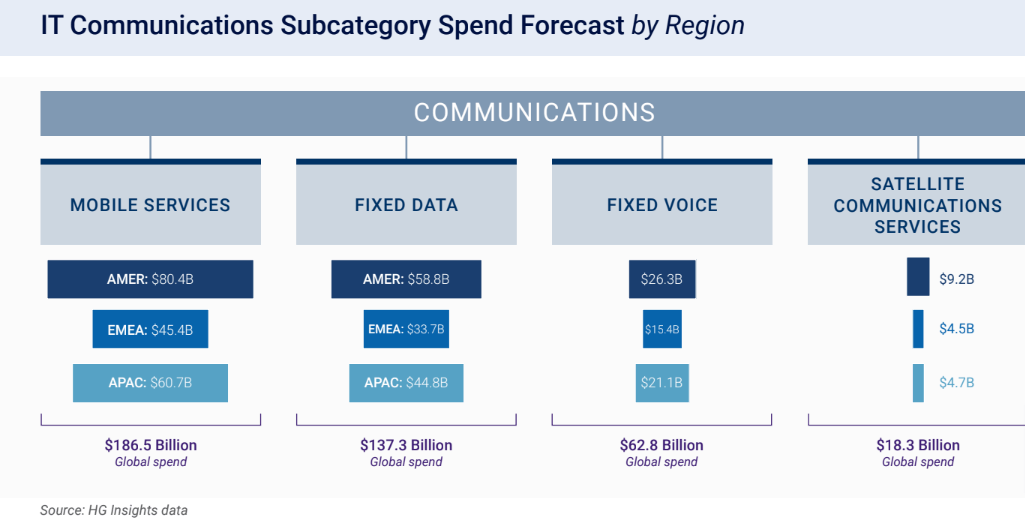
The bulk of spending on IT Communications comes from the Mobile Services and Fixed Data subcategories, which are forecasted to reach $186.5 billion and $137.3 billion, respectively. While the regional proportion pattern is the same across Fixed Data, Fixed Voice, and Mobile Services (and also tracks to many IT categories); more than 50% of the $18.3 billion in projected Satellite Communications Services spend comes from AMER.
Get Customized Market Insights
HG Insights uses advanced data science to process billions of unstructured digital documents to produce the world’s most sophisticated technology installation information, IT spend, contract intelligence, and intent data.
Further, HG gathers proprietary data through objective observation of cloud consumption. HG’s Global Sensor Network collects data from publicly deployed applications, infrastructure, and traffic to provide detailed insights on businesses’ cloud and data center product adoption, usage, and spend.
Our Customers use HG Insights to build Ideal Customer Profiles, size markets, find and acquire new customers, build account scoring models, and more. Contact us today to get a custom view of your market.


