
For B2B companies, understanding the market opportunity for a product or service is crucial. Without a clear framework, making decisions about where to allocate resources, invest sales and marketing efforts, and set realistic growth goals is just a shot in the dark. To achieve GTM success, businesses must be precise in sizing their market. Without precision, the likelihood of missed opportunities, or worse, going out of business, skyrockets.
This is where the TAM, SAM, SOM framework comes into play.
In this guide, you’ll learn how to build a TAM SAM SOM framework that’s proven to help your organization allocate resources more effectively, move faster, and align GTM teams around the best market opportunities
What is TAM, SAM, SOM?
TAM, SAM, and SOM are three important metrics used to determine the size of the market opportunity for a product or service, and where there is potential for growth. These metrics help businesses make strategic decisions around product development, marketing, and sales efforts.
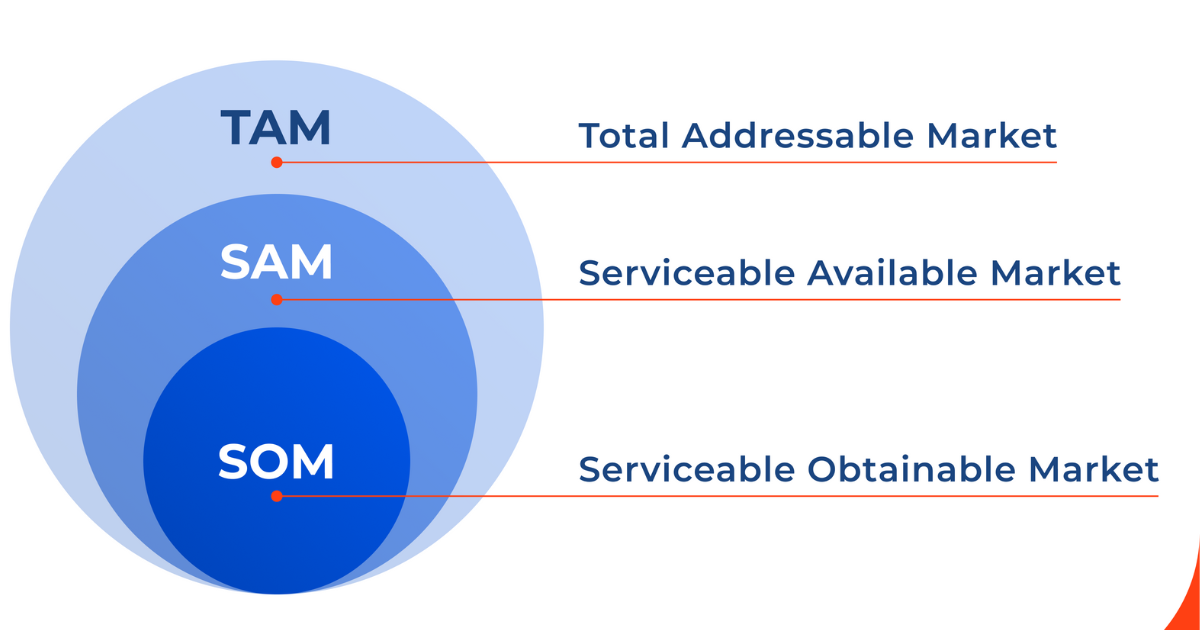
- TAM (Total Addressable Market) meaning: TAM represents the total market demand for a product or service. It encompasses the entire potential customer base within a specific market segment, regardless of whether they are currently reachable or likely to purchase from your company. Think of it as answering the question “How big is the pie?”
- SAM (Serviceable Addressable Market) meaning: SAM is a subset of TAM and refers to the portion of the market that your company can realistically target and serve given your current capabilities, resources, and geographical reach. It takes into account factors such as your product offering, distribution channels, and pricing strategy. You can think of SAM as answering the question, “What portion of the pie can I realistically get?”
- SOM (Serviceable Obtainable Market) meaning: SOM is the smallest subset of SAM and represents the portion of the market that you can realistically capture and convert into customers. It considers your market share, competitive landscape, and sales and marketing efforts. You can think of SOM as the question, “How much of the pie can I realistically get in the near term?”
In the following sections, we’ll dive deeper into the importance of TAM, SAM, and SOM, provide a step-by-step guide on calculating these metrics, and explore how HG Insights’ unique solution can help businesses leverage market intelligence for strategic planning and revenue growth.
Why TAM, SAM, SOM is Important for GTM Strategy
For B2B companies, especially those in the technology sector, success hinges on your ability to seize market opportunities and outpace the competition.
Understanding and leveraging the TAM, SAM, SOM framework is essential for several reasons:
- Understand market potential: TAM, SAM, and SOM analyses can help GTM leaders to understand the overall size and potential of the market for their products or services. This information can be used to make strategic decisions about which markets to target, which products to develop, and how to allocate resources.
- Identify the most promising target segments: SAM analysis helps GTM leaders to narrow down their focus to the segments of the market that they can realistically serve. This information can be used to develop targeted marketing and sales campaigns.
- Improve sales and marketing effectiveness: Accurately calculating TAM, SAM, and SOM allows businesses to better target their sales and marketing efforts and tailor their go-to-market strategies for maximum impact. This can lead to higher lead conversion and customer acquisition rates.
- Make informed business decisions: TAM, SAM, and SOM analysis provide organizations with valuable market data and insights, which they can use to make better business decisions about issues such as product development, pricing, resource allocation, and market entry strategies.
- Set realistic goals and expectations: SOM analysis helps GTM leaders to set realistic goals for market share and revenue. This information can be used to track progress and adjust the go-to-market strategy as needed.
- Attract investors: Clearly defined TAM, SAM, and SOM metrics can boost investor confidence. By demonstrating a large and growing market opportunity and a data-driven approach to taking advantage of this opportunity, companies can show investors that their business plan is based on facts and insights, not just assumptions
Think of TAM, SAM, and SOM as your GPS for navigating the market landscape. By quantifying your market potential at each level, you gain a clear understanding of the size of the prize and can set realistic targets for growth.
Putting Your TAM, SAM, SOM into Action
The benefits don’t stop there. Here are three key ways you can action your TAM, SAM, and SOM to align your business strategies with market realities:
- Prioritize high-value opportunities: Marketing and sales teams can use a TAM, SAM, and SOM analyses to prioritize leads and focus their efforts on the accounts that are most likely to close
- Optimize resource allocation: With a clear picture of your serviceable obtainable market, you can make informed decisions about where to invest your time, money, and talent for maximum profitability.
- Adapt to market changes: Regular TAM, SAM, and SOM analysis helps you stay attuned to market dynamics and adjust your strategies as needed to capitalize on new opportunities or mitigate risks.
In short, TAM, SAM, and SOM market analysis are essential for any B2B company looking to drive sustainable growth and stay ahead of the curve. By leveraging these metrics in your strategic planning, you can make smarter decisions, seize untapped potential, and chart a course for long-term success.
How to Calculate TAM, SAM, SOM
Now that you understand the importance of TAM, SAM, and SOM, let’s dive into the definitive framework for how to calculate these metrics for your business.
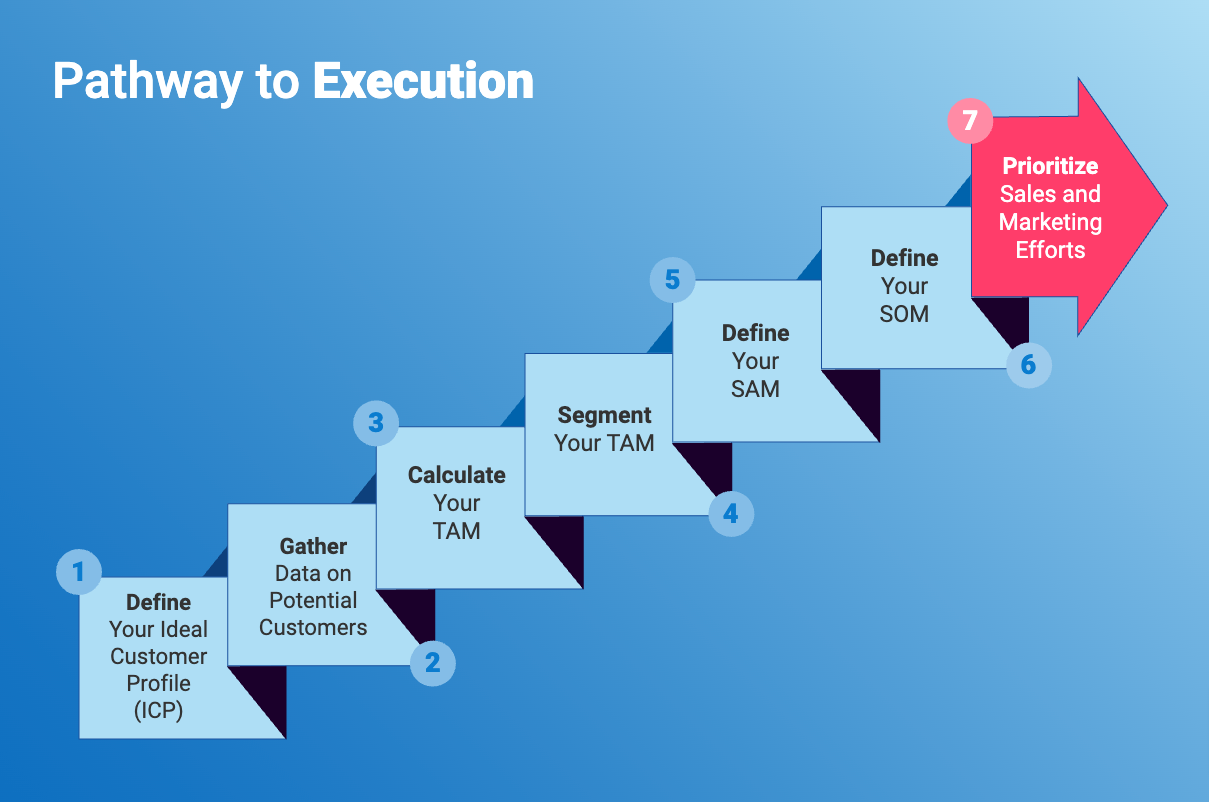
Estimating market opportunity is both an art and a science, but by using this framework, you can arrive at reliable figures to guide your strategic planning and execution. Here’s the step-by-step breakdown:
1. Define Your Ideal Customer Profile
Pinpoint the characteristics of customers who will benefit the most from your product or service. This is your ideal customer profile (ICP). Defining your ICP ensures that you direct your resources and marketing efforts toward the most promising opportunities.
This process involves identifying key attributes of your best-fit customers across three categories: firmographics (company size, industry, location), behavioral (growth stage, challenges, purchasing behavior), and technographics (technologies used, particularly those signaling a need for your product).
2. Gather Data on Potential Customers
Leverage available tools and resources to identify companies that align with your ICP, combining first and third party data. This process involves gathering data about the technology they use, their spending habits, and any current challenges they may face.
You can leverage HG’s Platform to identify companies that fit your ICP and understand their spending habits, technology stack, and potential needs. Simply employ the platform’s search and filtering capabilities to narrow down companies based on your defined ICP criteria, all within minutes.
3. Calculate Your TAM
Calculate the overall market size for your solution. Use data-driven tools to find the number of companies that align with your ICP and determine their spending on relevant solutions. By aggregating this data, you can project the total size of your target market. A bottom-up approach that factors in individual company spend can provide a more accurate estimate than broad estimates alone.
HG Insights offers spend data so you can see how much companies are spending on specific IT solutions. But in lieu of spending data, to calculate your Total Addressable Market (TAM), multiply the total number of potential customers in your target market by the average revenue per customer. For example, if there are 1,000 companies in your target market and the average contract value is $50,000, your TAM would be $50 million.
4. Segment Your TAM
Divide your TAM into smaller segments based on shared characteristics to enable more focused targeting.
Consider segmenting by:
- Industry: For example, focus on industries with higher ERP adoption rates or those experiencing rapid growth.
- Company Size: Target specific size ranges most likely to adopt your ERP software.
- Technology Usage: Identify companies with technology stacks compatible with your solution or those using competing systems nearing the end of their life cycle.
5. Define Your SAM
Your Serviceable Addressable Market(SAM) is the portion of your TAM that you can realistically serve. Consider your company’s geographic reach, distribution channels, resources, and partner network to assess your serviceable market.
To calculate SAM, apply a percentage to your TAM based on factors like market share, competition, and sales capacity.
For instance, if you estimate that you can capture 20% of your TAM, your SAM would be $10 million.
6. Define Your SOM
Your Serviceable Obtainable Market (SOM) is the portion of your SAM that you can realistically convert into paying customers. To calculate SOM, consider factors like sales cycle length, win rates, and market penetration.
You can combine HG’s Platform data with internal sales data and assumptions about market penetration to define your SOM. This involves a degree of projection based on your go-to-market capabilities and competitive landscape.
For example, if you estimate that you can close 10% of your SAM over the next year, your SOM would be $1 million.
7. Prioritize Sales and Marketing Efforts
Align resources with the most promising segments and accounts within your SOM. Leverage insights from your TAM, SAM, and SOM analysis to develop targeted sales and marketing campaigns, prioritizing accounts with the highest potential.
Common Pitfalls and Best Practices
Calculating TAM, SAM, and SOM is rarely a straightforward process. Common challenges include:
- Defining your target market too broadly or narrowly
- Overestimating your serviceable market based on overly optimistic assumptions
- Underestimating the impact of competition on your obtainable market
To overcome these challenges, it’s important to:
- Conduct thorough market research to validate your assumptions
- Use a bottom-up approach based on real customer data whenever possible
- Regularly review and adjust your calculations as market conditions change
By following these best practices, you can arrive at reliable TAM, SAM, and SOM figures to inform your strategic planning and drive growth for your business.
Market Analysis Tools: Getting Better with TAM, SAM, SOM
Having accurate market intelligence is key to sizing your market. But with so much data scattered across different systems and sources, getting a clear picture of your TAM, SAM, and SOM can be daunting.
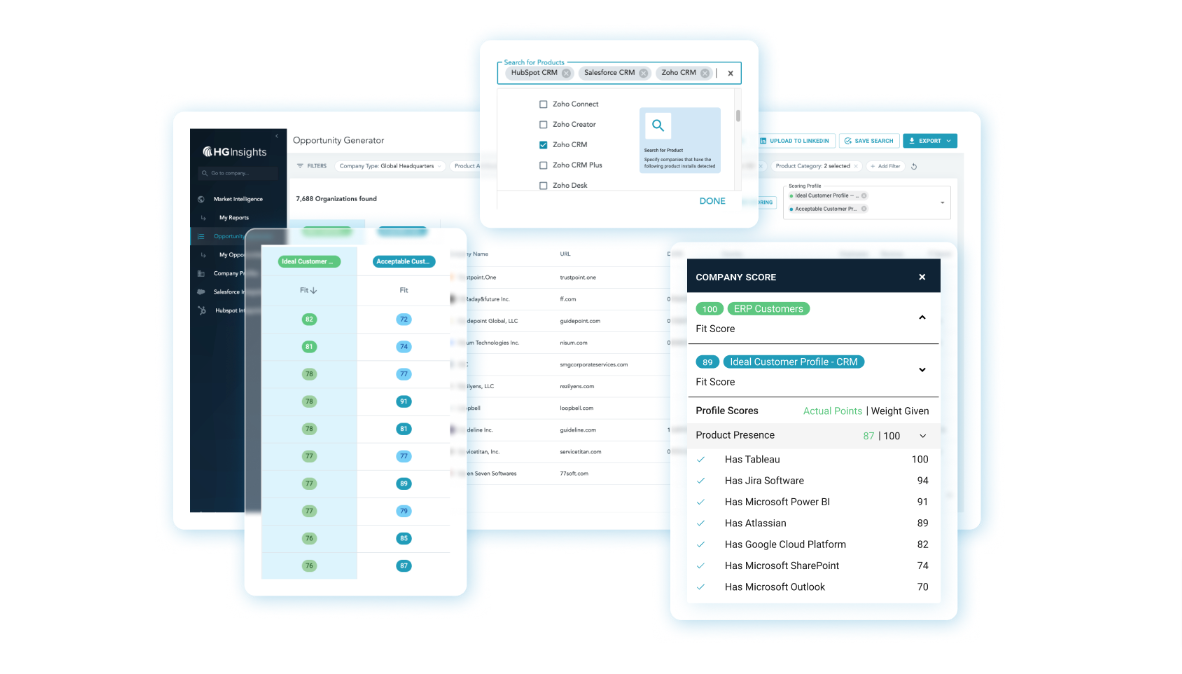
HG Insights’ Platform is the only solution that allows you to create your TAM, SAM, SOM based on your ICP and then drill down to account-level insights across multiple dimensions of intelligence.
It brings together technology installs, firmographic, spend, competitor, contract, partner, and AI-related data to give you a comprehensive view of your market opportunity, and everything can be viewed through a unified lens at the account level. With actionable data, teams can confidently assess market opportunities, allocate resources effectively, and make smarter decisions on product development, pricing, and GTM strategies.
“When you get all these data points aggregated together at an account-level, and all the accounts add up to your TAM, SAM, SOM, that’s fantastic. Now you have a precise solution you can actually use. That’s why we are a leader in Revenue Growth Intelligence that drives revenue growth, customer retention, operational efficiency, and, most importantly, strategic alignment across the entire organization.”
– Rohini Katsuri, CEO
Here are just a few of the benefits of using HG Insights’ Platform:
- Market Sizing: Simplify market sizing exercises with the only solution that goes from market-level views down to the account level. HG Insights’ advanced algorithms and machine learning models help you calculate your TAM, SAM, and SOM with unparalleled accuracy. Get detailed market data and drill down to the individual accounts, to identify your most valuable opportunities and seize them.
- Ideal Customer Profile: Create dynamic, pinpoint-accurate ideal customer profiles (ICPs) to target the right accounts at the right time. Focus on accounts with the highest propensity to buy and greatest revenue potential. Avoid wasting resources on incompatible or low-budget prospects, while refining your ICP for a more nuanced view of target customers.
- Account Prioritization: With HG Insights’ account scoring and prioritization tools, you can focus your sales and marketing efforts on the accounts that are most likely to convert. By analyzing factors like technographic fit, intent signals, and firmographic data, HG Insights can help you create targeted account lists and personalized outreach strategies.
- Evolving with Market Dynamics: Markets are in constant flux. With HG Insights, your TAM/SAM/SOM is constantly updated based on real-time data, helping you stay ahead of competitors and continuously optimize your GTM efforts.
For companies selling technology, no solution will give you more visibility into the size of your exact market or the technology landscape of your customers than HG Insights.
Take a guided tour to understand the different types of data you can view on our platform.
Take a Tour →