For B2B go-to-market teams, knowing which accounts to target in your sales and marketing efforts is a common challenge. How do you identify the companies that are most likely to become customers?
To find your target accounts, you have to answer essential questions around: Are they actively looking for solutions like yours? Do they use technologies that you compete with, and/or complement your product? And if they do, are they satisfied with those solutions?
Enter technographic data. Technographic data can tell you what IT software and hardware your prospects use. It also reveals how they use it.
This important information helps marketing and sales teams find the accounts that fit the solution well and are most likely to convert into paying customers. They can then target these high-value accounts in ABM campaigns and sales outreach efforts.
In this guide, you’ll learn about technographic data: what it is, how to use it, and why technographics matter in B2B. This knowledge will help you connect with the right prospects sooner, shorten sales cycles, and improve your ABM strategies.
What is Technographic Data?
Technographic data is detailed information about the technology a company uses. This includes hardware, software, and IT systems that companies have installed. Technographic data can often include IT spending, cloud service providers, and partner integrations as well. Essentially, technographics paint a picture of how a business buys and uses technology.
Best-in-class technographic data can show you:
- A bird’s eye view of a company’s tech stack
- When a customer adopted a specific software
This information allows you to:
- Identify companies that are actively investing in technology solutions similar to yours.
- Pinpoint gaps where your product can integrate into their tech stack.
Technographics are often paired with firmographic data, which includes company information like industry, size, and revenue. Combining technographics with firmographic data gives you a fuller view of a business. This helps you see if the company fits your demographic criteria and your ideal technology profile.
Why Technographics Matter in B2B
Technographic data has become crucial for B2B companies. With technology deeply embedded in how businesses operate, knowing what technology a company uses can inform marketing, sales strategies, and customer interactions.
By analyzing a company’s tech stack, sales and marketing teams can:
- Identify ideal prospects that use competing technologies or technologies compatible with their products. This allows teams to prioritize leads and streamline outreach.
- Use ABM strategies by building personalized campaigns based on technographic insights.
- Tailor messaging to resonate with their target audience’s current tech environment.
Technographics can also reveal opportunities for cross-selling or upselling by identifying companies that may need complementary tools or services. In short, technographic data helps companies be more strategic, efficient, and relevant in their sales and marketing efforts.
How is Technographic Data Collected?
Collecting technographic data can be done in several ways:
- Surveys: Companies may ask clients or prospects about their tech setup. While this can be accurate, it can also be time-consuming and yield low response rates.
- Web scraping: This technique involves extracting data from public sources like websites, job postings, and online forums. It can collect a lot of data quickly, but outdated information can cause accuracy issues.
- Third-party data providers: Companies like HG Insights focus on collecting and organizing technographic data. They use surveys, web scraping, and their own methods. Working with reputable providers ensures more reliable data.
In short, the key to technographic data is accuracy. Inaccurate or old data can lead to poor decision-making and missed opportunities, making it essential to validate and regularly update data.
When to Use Technographic Data
Technographic data is widely used across sales and marketing to improve targeting, engagement, and conversion rates. Here’s how it’s applied:
Customer Segmentation
Businesses can segment their audience based on the technology they use. By understanding the technologies, tools, and systems a company uses, businesses can adjust their messaging. They can also change product recommendations and support to fit the prospect’s specific needs.
For example, a software company can find potential customers who use specific tools. It can then adjust its messaging to show how its solution is better than what they currently have.
Account-Based Marketing (ABM)
Technographics are critical in ABM, a strategy that focuses on targeting specific, high-value accounts. By understanding a company’s tech environment, businesses can create personalized campaigns. These campaigns will resonate with the unique needs of that organization.
For instance, if a business specializes in cloud software, it can target companies still using on-premise solutions, increasing the chance of successful outreach.
Account Prioritization
In sales, technographics help identify high-value prospects, tailor pitches, and streamline the sales process. Technographic data enables B2B sales teams to prioritize leads by targeting prospects that use competing technologies or technologies that complement their products or services.
Sales teams can use technographic data to focus on leads more likely to convert based on their current technology installs. By understanding a prospect’s tech stack, sales teams can anticipate their challenges and offer more targeted solutions, making their pitches more relevant and effective.
Competitor Analysis
Understanding what your competitors are offering — and who they’re targeting — gets much simpler with technographics.
By leveraging technographic data, you can pinpoint your competitors’ clients and gain insight into their Ideal Customer Profile (ICP).
This helps you fine-tune your strategies to engage high-value accounts, while identifying the tools and platforms commonly adopted by businesses in particular industries or of specific sizes.
Market Expansion
When you’re considering entering new markets or expanding your product offerings. Technographics can provide insights into the technology landscape of potential customers in your total addressable market (TAM), helping you make informed decisions.
Resource Allocation
When you need to allocate marketing and sales resources more efficiently. Technographics help you focus your efforts on the account segments that are most likely to convert.
This ensures that your budget and headcount is allocated to the right accounts, instead of chasing after prospects that have no need for your product or service, wasting money, time, and effort.
The Benefits of Using Technographics
Integrating technographics into your data stack has several key advantages:
Lead Prioritization
By understanding a prospect’s tech stack, marketing and sales teams can identify which leads are more likely to convert into paying customers.
This allows them to focus their efforts on high-potential prospects, making both lead generation and account prioritization more efficient.
Enhanced Targeting
Businesses can create highly targeted campaigns that resonate with the specific technologies used by their prospects.
When you know what technologies your prospects use, GTM teams can segment accounts for campaign targeting and craft personalized messaging that speaks to specific pain points, improving engagement and conversion rates.
Reduced Sales Cycles
Knowing a prospect’s technology landscape ahead of time allows sales teams to have more informed conversations.
It ensures Discovery calls are more effective, because sales reps are armed with knowledge going into the conversation, speeding up the decision-making process and shortening the sales cycle.
Customer Success
Technographics also help businesses provide better onboarding, support, and training by understanding a customer’s tech ecosystem. This personalized support fosters stronger customer relationships and long-term loyalty.
Explore HG’s Data

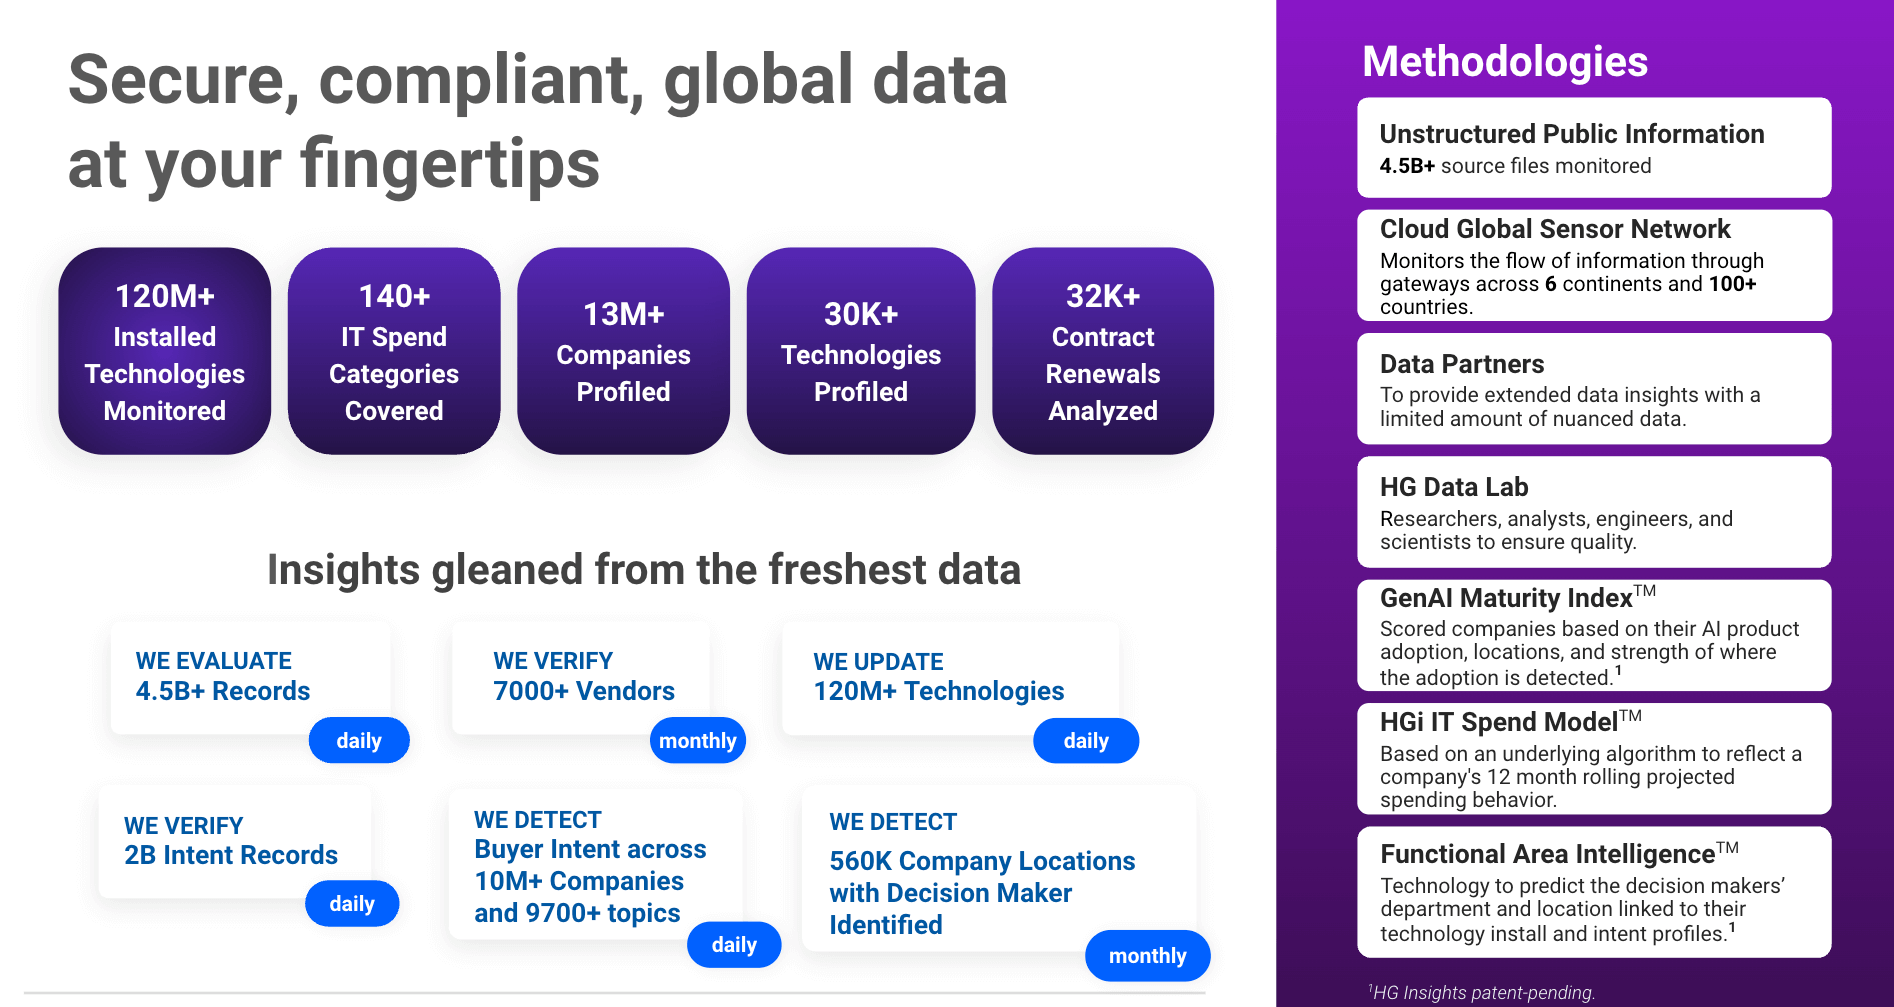
At HG, technographic data is our bread and butter. While we provide a suite of data sets, from contract intelligence to IT spend data, no other company on the planet offers the depth and breadth of our technology installation data.
And our technographics don’t stop at the company-level. Using our Platform, you can drill down by company, subsidiary, headquarter location, and department to find the decision maker behind a specific technology — so your sales and marketing teams can target with precision.
Try Our Technographics for Free
You can explore our technographics on this free platform. This sandbox site lets you basically “plug and play” with our data. Simply input a competitor or a complementary technology in the search bar to see the companies with that product installed.
Yep, it’s that easy and there are no strings attached.
So what are you waiting for? Now that you’ve learned all about technographics and how businesses can achieve more targeted outreach and better sales outcomes, it’s time to get started. Explore the HG Discovery Platform today →


