Key Takeaways:
- $72.1 billion in projected spend on Business Intelligence software in the next 12 months.
- 43% of spend on BI software comes from the AMER region.
- Nearly 2 million companies in the United States will spend $27.3 billion on BI solutions in the next 12 months.
- 53% of spend on BI solutions comes from companies with revenue of $5 billion or more.
- Finance & Insurance, Public Administration, and Manufacturing spend the most in the global Business Intelligence market.
The global Business Intelligence (BI) market is continuing to grow, as organizations seek advanced tools for data-driven decision-making. According to HG’s data, companies will spend $72.1 billion globally on BI software in the next 12 months. Due to the market dynamics and increasing demand for BI solutions, HG Insights wanted to dive deeper into this exciting tech sector.
Business Intelligence covers the software applications used for data analysis, visualization, reporting, advanced analytics, and more. BI tools can be sold as on-premises software (i.e. via license or subscription) or as cloud-based solutions (i.e. SaaS). BI solutions help companies turn their data into actionable insights that improve decision-making and give them a competitive edge.
This report provides HG’s research on the Business Intelligence market and covers global spending, leading vendors, solutions, and buyer profiles. The data was uncovered with the HG Revenue Growth Intelligence Platform and will help you identify your distinct opportunities in the Business Intelligence software market.
Business Intelligence Market Size
According to HG’s data, the total Business Intelligence market size (the total spend on Business Intelligence platforms) is projected to reach $72.1 billion in the next 12 months.
Total Spend on Business Intelligence Software by Region
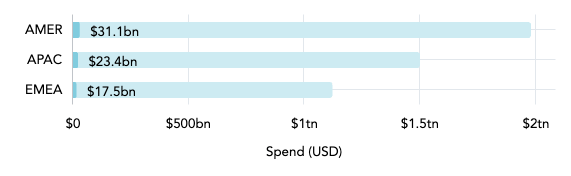
This chart shows the proportion of Business Intelligence industry spend (dark blue) to total IT spend (light blue) in each region.
Out of the three global regions, AMER (North, Central, and South America) spends the most on Business Intelligence solutions, accounting for 43% of spending. APAC (Asia Pacific) accounts for 32% of global spend and 24% comes from EMEA (Europe, Middle East, and Africa).
Top 10 Countries for Business Intelligence Software Market
| Country | Spend | Companies |
| United States | $27,268,758,767 | 4,356,643 |
| China | $9,767,887,263 | 183,972 |
| Japan | $4,345,018,116 | 161,782 |
| United Kingdom | $3,823,923,912 | 640,562 |
| Germany | $2,670,550,595 | 402,557 |
| India | $2,312,753,235 | 277,095 |
| Canada | $1,938,751,724 | 404,386 |
| France | $1,729,845,889 | 203,525 |
| Republic of Korea | $1,581,827,244 | 36,085 |
| Netherlands | $1,451,893,792 | 167,858 |
According to HG’s data, nearly 2 million companies in the United States spend $27.3 billion on BI solutions, accounting for 38% of the total Business Intelligence software market. Other key markets include China, Japan, and the United Kingdom, making up 14%, 6%, and 5% of global spend, respectively.
Business Intelligence Software Market Share
Leading Vendors in the Business Intelligence Software Market
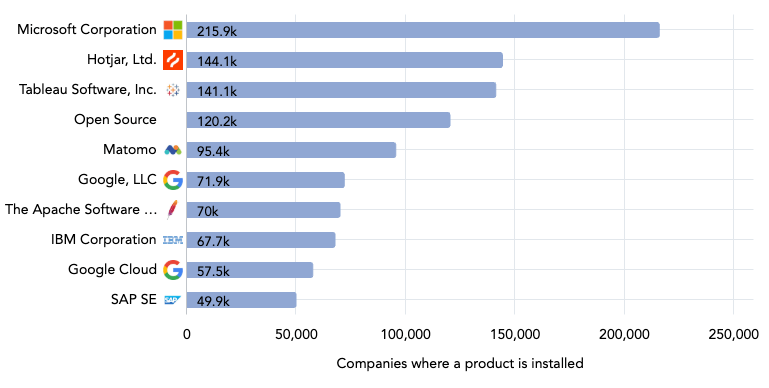
The Business Intelligence software market differs from some other markets for cloud-based solutions, with no one vendor completely dominating the market. This chart shows the 10 leading market players by detected installations. Please note that the HG Insights Platform includes only businesses with registered addresses in its data analysis.
Microsoft, the maker of Power BI, drives the market and is the top vendor in terms of the number of installs with 215,856 companies. Hotjar and Tableau are neck and neck with 144,143 installs and 141,136 installs, respectively. The fourth largest vendor is not a vendor at all, but a compilation of all open source solutions in the BI market.
Top 10 Business Intelligence Solutions

This chart shows the 10 leading products in the Business Intelligence software market, with Microsoft’s Power BI (204,512 installs), Hotjar (144,143), and Tableau (141,135) taking the lead.
Other key players – aside from R Project, which is open source – include Matomo, Apache Spark, and additional Microsoft products like SQL Server and Power Platform.
Want to learn more about leading providers and products in other verticals? Check out our market reports here →
Buyer Landscape of the BI Market
Due to the increasing number of BI tools and vendors on the market – and the capabilities offered by these solutions – the number of buyers continues to expand, offering greater opportunities for sellers in the Business Intelligence market (or complementary categories). This section digs deeper into buying trends within the global Business Intelligence market. More specifically, into the number of buyers, classified by industry and company size, and how much they’re spending on BI software.
Business Intelligence Spending by Company Size (Revenue)
| Revenue | Total Spend | Companies |
| $5bn+ | $38,063,398,252 | 6,859 |
| $1bn to $5bn | $12,708,345,314 | 22,648 |
| $500m to $1bn | $5,140,476,893 | 28,797 |
| $200m to $500m | $6,016,915,773 | 66,177 |
| $100m to $200m | $4,022,541,250 | 91,198 |
| $50m to $100m | $3,189,856,829 | 169,448 |
| $10m to $50m | $1,435,641,438 | 1,015,308 |
| $1m to $10m | $274,850,626 | 4,251,811 |
| Less than $1m | $57,097,622 | 2,250,768 |
Companies earning more than $5 billion in revenue make up more than half (53%) of the total Business Intelligence market size. However, only 6,859 buyers fall in this revenue tier.
Over one-quarter (26%) of spending on Business Intelligence software – a tier worth $18.4 billion – comes from 355,620 companies with revenue between $50 million and $1 billion.
Business Intelligence Spending by Company Size (Employees)
| Employees | Spend | Companies |
| 10,000+ | $32,046,324,199 | 13,539 |
| 5,000 to 9,999 | $6,475,826,002 | 14,266 |
| 1,000 to 4,999 | $15,133,012,511 | 99,421 |
| 500 to 999 | $4,888,031,672 | 90,848 |
| 200 to 499 | $4,987,063,996 | 323,668 |
| 50 to 199 | $4,139,191,838 | 934,618 |
| 1 to 49 | $2,263,163,432 | 5,776,999 |
This chart shows spending within the BI industry by company size (number of employees). As with most sectors, larger companies (by number of employees) tend to account for the highest spending.
While companies in the 3rd tier (1,000 to 4,999 employees) spend more overall than those in the second tier (5,000 to 9,999 employees), the higher count of businesses means a lower average spend per company.
Business Intelligence Software Spend by Industry
| Industry | Spend | Companies |
| Finance and Insurance | $20,124,996,606 | 337,356 |
| Public Administration | $13,570,855,333 | 187,750 |
| Manufacturing | $11,619,962,674 | 686,660 |
| Professional, Scientific, and Technical Services | $5,475,270,183 | 1,326,319 |
| Health Care and Social Assistance | $4,215,670,561 | 364,186 |
| Information | $3,312,268,167 | 434,522 |
| Educational Services | $2,478,823,011 | 234,257 |
| Transportation and Warehousing | $2,298,889,628 | 121,050 |
| Wholesale Trade | $2,093,600,279 | 257,375 |
| Retail Trade | $2,047,432,011 | 405,364 |
| Utilities | $1,474,946,810 | 30,280 |
| Administrative and Support and Waste Management and Remediation Services | $1,091,233,229 | 268,920 |
| Mining, Quarrying, and Oil and Gas Extraction | $665,127,613 | 34,274 |
| Construction | $587,320,577 | 309,220 |
| Real Estate and Rental and Leasing | $361,513,465 | 215,880 |
| Arts, Entertainment, and Recreation | $273,341,599 | 248,192 |
| Accommodation and Food Services | $221,995,908 | 212,310 |
| Other Services (except Public Administration) | $80,566,535 | 443,734 |
| Agriculture, Forestry, Fishing and Hunting | $58,679,575 | 37,799 |
According to HG data, the Finance & Insurance, Public Administration, and Manufacturing sectors spend the most in the Business Intelligence sector, accounting for 63% of the overall spend. The Finance & Insurance and Public Administration industries both have high spend ($20.1 billion and $13.6 billion, respectively) paired with a relatively low number of installs (337,356 and 187,750), which indicates a high average spend per company.
Meanwhile, the Manufacturing sector spends more than $11.6 billion on BI solutions but this is spread across 686,660 buyers. In terms of customer count, only the Professional, Scientific, & Technical Services sector has more buyers, with 1,326,319.
Uncover Business Intelligence Opportunities with HG Insights
The HG Revenue Growth Intelligence Platform enables go-to-market (GTM) teams to drill down into the size, shape, and structure of their target markets. HG’s data helps businesses analyze vendor penetration, size markets, identify accounts matching an ICP, uncover white space opportunities, and prioritize the best-fit accounts to shorten sales cycles.
In this step-by-step video, Enterprise Account Director Kevin Scott showcases how one of his customers leveraged HG Insights’ Technology Intelligence to uncover a $200M opportunity in the Business Intelligence market:
The HG platform enables users to filter companies by their usage of different products, offering segment analyses at a global level as well as drilled down by IT spend, firmographic filters, IT spend budget, tech installs, and more. Request a free data sample to see your ICP accounts and spot opportunities in the Business Intelligence market.
HG Insights enables users to filter companies by their usage of different products, offering segment analyses at a global level as well as drilled down by IT spend, firmographic filters, IT spend budget, tech installs, and more. Request a free data sample to see your ICP accounts and spot opportunities in the Business Intelligence market.