Key Takeaways:
- The global CRM market size is projected to reach $53 billion in the next 12 months
- 37% of spending on Customer Relationship Management software comes from buyers in the United States
- Salesforce, Zoho, and HubSpot lead in CRM market share by number of installations
- 73.8% of spending on CRM software comes from companies with more than 1,000 employees
- The sectors that spend the most on CRM software are Finance & Insurance; Public Administration; and Professional, Scientific, and Technical Services
Given the critical importance of customer engagement and experience across businesses, the Customer Relationship Management market is thriving. According to HG’s data, $53 billion will be spent globally on CRM solutions over the next 12 months.
CRM covers all the processes and strategies used to manage a company’s interactions and relationships with both current and prospective customers. CRM solutions are software applications used to enable and optimize all of these processes. As the industry evolves, we are seeing vendors incorporate the latest technologies into their products, including Machine Learning (ML) and Artificial Intelligence (AI).
This report leverages proprietary insights from the HG Insights platform to deliver a comprehensive view of the Customer Relationship Management (CRM) market. It offers an in-depth analysis of CRM market share, global spending trends, leading CRM vendors, and buyer profiles.
Customer Relationship Management Market Size
The global Customer Relationship Management market size is projected to reach $53 billion in the next 12 months – about 1% of total external IT spending and 3.7% of all software spending.
CRM Market Size by Region

This chart shows the portion of CRM software market spend (dark blue) to total IT spend (light blue) in each region. CRM is one of more than 20 distinct spend categories that sit within Enterprise Resource Planning (ERP) applications, which also include Financial Applications, Human Capital Management (HCM), and Sourcing and Procurement Applications.
Companies in AMER (North America, Central America, and South America) spend the most on CRM solutions – $22.5 billion – out of all three regions, accounting for 42.4% of all spend. APAC (Asia Pacific) and EMEA (Europe, Middle East, and Africa) make up 33.5% and 24.1% of global CRM spending, respectively.
Top 10 Countries by CRM Spending
| Country | Spend | Companies |
| United States | $19,639,011,465 | 4,663,758 |
| China | $7,518,770,500 | 196,311 |
| Japan | $3,072,706,865 | 164,175 |
| United Kingdom | $2,959,709,754 | 676,479 |
| Germany | $1,816,927,538 | 413,318 |
| India | $1,692,280,387 | 307,555 |
| Canada | $1,450,553,359 | 431,933 |
| Australia | $1,307,938,637 | 343,748 |
| France | $1,177,546,061 | 208,553 |
| Republic of Korea | $1,155,445,545 | 36,643 |
Source: This data was uncovered with HG Market Analyzer and includes only businesses with registered addresses
According to HG’s data, there are nearly 4.7 million companies in the United States expected to spend $19.6 billion on Customer Relationship Management software during the forecast period, making up 37% of the total CRM market size. China, Japan, and the United Kingdom are the three next largest markets, making up 14.2%, 5.8%, and 5.6% global CRM spending, respectively.
CRM Market Share
Leading Vendors by CRM Market Share
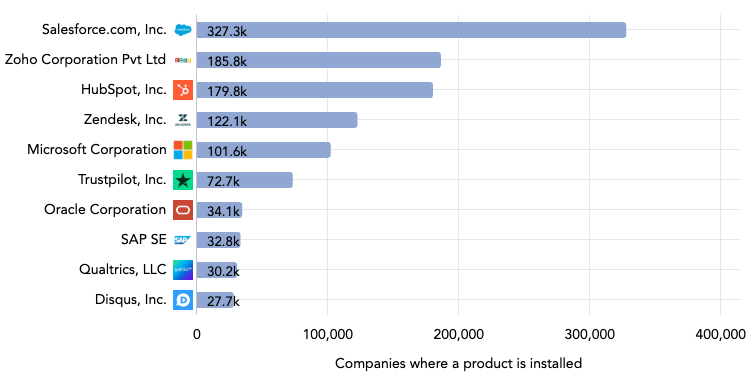
This chart illustrates the 10 leading CRM vendors by their market share (global customer count). To ensure our data is both accurate and actionable, HG data includes only businesses with registered addresses in its data analysis and market insights.
Salesforce claims the largest share of the CRM market by far with 327,297 customers. Zoho and Hubspot make up the next tier, with 185,822 customers and 179,843 customers, respectively.
Top 10 Customer Relationship Management Software
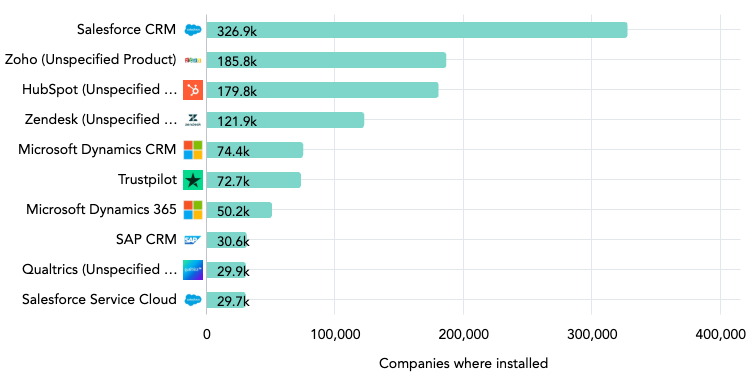
This chart displays the 10 leading products by CRM market share. The top five products align with the top five vendors, although Microsoft’s CRM market share is split between multiple products.
For more market insights on the leading products and market players across verticals, check out our market reports →
Buyer Landscape of the Customer Relationship Management Market
With buyers looking to enhance customer experience for their own customers, CRM vendors are doing the same — making consistent improvements and growing the market year-over-year. As the number of buyers increases, so does the opportunity for sellers of CRM solutions (and sellers in complementary categories).
This section dives deeper into CRM market trends and the buyer landscape: Specifically, the number of buyers classified by industry, company size, and how much they’re spending on CRM software.
CRM Market Spend by Buyer Size (Revenue)
| Revenue Range | Spend | Companies |
| $5bn+ | $27,682,118,842 | 7,146 |
| $1bn to $5bn | $9,670,470,568 | 23,556 |
| $500m to $1bn | $3,857,733,539 | 29,283 |
| $200m to $500m | $4,485,819,410 | 67,393 |
| $100m to $200m | $2,920,949,034 | 91,745 |
| $50m to $100m | $2,355,510,388 | 170,976 |
| $10m to $50m | $1,107,252,254 | 1,044,530 |
| $1m to $10m | $239,095,409 | 4,502,112 |
| Less than $1m | $53,709,169 | 2,418,959 |
Source: This data was uncovered with HG Market Analyzer and includes only businesses with registered addresses
More than half (52.2%) of spending in the CRM market comes from companies in the highest revenue tier ($5 billion and above). The next largest bucket consists of approximately 52,839 companies earning between $500 million and $5 billion, accounting for about one-quarter (25.5%) of CRM spending.
The $1–$10 million revenue tier makes up only 0.5% of CRM spending, but the tier includes the majority of CRM buyers (53.9%) illustrating that CRM solutions are essential, even for small businesses.
CRM Market Spend by Buyer Size (Number of Employees)
| Employees | Spend | Companies |
| 10,000+ | $22,804,553,090 | 14,336 |
| 5,000 to 9,999 | $4,695,581,394 | 14,998 |
| 1,000 to 4,999 | $11,607,716,654 | 103,415 |
| 500 to 999 | $3,699,180,027 | 93,991 |
| 200 to 499 | $3,769,746,164 | 335,444 |
| 50 to 199 | $3,499,945,431 | 964,929 |
| 1 to 49 | $2,217,449,499 | 6,201,903 |
Source: This data was uncovered with HG Market Anayzer and includes only businesses with registered addresses
CRM market trends for spending largely align with the company size by number of employees and revenue: Fewer companies exist in the larger-sized tiers (number of employees or revenue), but those companies spend more on CRM solutions (and typically spend exponentially more on IT in general).
HG’s data indicates that nearly three-quarters (73.8%) of total spending on CRM software comes from companies with more than 1,000 employees.
CRM Software Spend by Industry
| Industry | Spend | Companies |
| Finance and Insurance | $18,293,496,269 | 348,629 |
| Public Administration | $7,859,751,187 | 193,482 |
| Professional, Scientific, and Technical Services | $7,015,076,652 | 1,373,604 |
| Manufacturing | $4,611,720,334 | 704,328 |
| Information | $3,459,880,048 | 449,938 |
| Health Care and Social Assistance | $3,071,025,825 | 378,107 |
| Administrative and Support and Waste Management and Remediation Services | $1,390,768,922 | 282,308 |
| Educational Services | $1,343,472,049 | 242,154 |
| Retail Trade | $1,272,919,914 | 424,229 |
| Wholesale Trade | $1,272,511,529 | 265,212 |
| Transportation and Warehousing | $1,108,345,005 | 124,769 |
| Utilities | $918,039,614 | 30,563 |
| Construction | $363,385,418 | 319,585 |
| Real Estate and Rental and Leasing | $277,557,062 | 225,383 |
| Arts, Entertainment, and Recreation | $243,759,575 | 259,565 |
| Accommodation and Food Services | $227,402,371 | 224,533 |
| Mining, Quarrying, and Oil and Gas Extraction | $170,372,306 | 35,068 |
| Other Services (except Public Administration) | $87,838,443 | 462,213 |
| Agriculture, Forestry, Fishing and Hunting | $29,464,827 | 39,480 |
Source: This data was uncovered with HG Market Analyzer and includes only businesses with registered addresses
According to HG data, the Finance & Insurance; Public Administration; and Professional, Scientific, and Technical Services sectors spend the most in the CRM market, accounting for 62.6% of the overall spend.
However, while some sectors like Professional, Scientific, and Technical Services and Manufacturing have some of the highest spend on CRM software — $7.0 billion and $4.6 billion, respectively — this spend is spread across a larger number of buyers compared to other industries, indicating a lower average spend per CRM buyer. Out of any listed industry, Professional, Scientific, and Technical Services has the highest number of buyers: Nearly 1.4 million customers.
While Finance and Insurance ($18.3 billion) and Public Administration ($7.9 billion) are the top spenders on CRM software, the number of buyers in these industries (348,629 and 193,482 respectively) is relatively low. This suggests a significantly higher average CRM spend per customer in these sectors.
Uncover CRM Market Opportunities with HG Insights
The HG Insights Platform helps you size your Total Addressable Market (TAM), identify prospects that fit your Ideal Customer Profile (ICP), score and segment target accounts, and efficiently allocate sales resources and plan territories.
In addition, with HG Insights’ CRM integrations, connecting our best-in-class data set with your existing tech stack – from Hubspot to Salesforce to LinkedIn and more – has never been easier.
In this short video, Sales Manager Christian Arce showcases how one of his customers leveraged HG Insights’ data to uncover a $13.5B CRM Applications opportunity.
As you can see, HG Insights goes beyond traditional data and is far more granular and actionable than that of providers like Gartner or IDC. To explore our data capabilities for yourself, check out our free platform and see the accounts buying your competitors’ products.

