Key Takeaways:
- Companies are projected to spend $22.6 billion globally on ecommerce platforms in the next 12 months.
- The United States makes up 37% of the ecommerce platform market size, with $8.4 billion in projected spend.
- Automattic, Inc. – parent company of WooCommerce – has the largest customer base with product installations detected at 430,000 companies.
- Companies earning over $5 billion in annual revenue account for 51% of all spending on ecommerce platforms.
- Industries with the highest spend include Finance & Insurance, Manufacturing, and Public Administration.
As the world shifts toward online shopping, demand for ecommerce platforms – tools used by ecommerce businesses for online sales – is skyrocketing. Whether we’re discussing major players like Amazon or a one-person online store, the growth of top ecommerce platforms has empowered online businesses to boost the shopping experience and expand their potential customer base to anyone with an internet connection.
HG Insights’ data helps go-to-market teams by providing a high-resolution view into product adoption and spend. With this focused lens, HG projects that companies will spend $22.6 billion globally on ecommerce platforms over the next 12 months. (This data includes only businesses with registered addresses.)
HG’s report provides market research on the ecommerce platform market, including global spending, top vendors, and buyer profiles.
Ecommerce platform market size
Total ecommerce platform market size per region
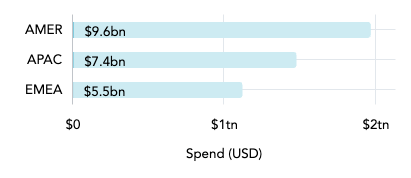
This chart shows the proportion of the ecommerce platform market size (dark blue) to total IT spend (light blue, bottom legend) in each region. According to HG data, spending on ecommerce platforms is projected to be $22.6 billion during the forecast period. 43% of this spending comes from buyers in the AMER region (North, Central, and South America), with 33% coming from EMEA (Europe, Middle East, and Africa) and 24% from APAC (Asia Pacific).
The 10 leading countries by ecommerce platform market size
| Country | Total Spend | Companies |
| United States | $8,446,468,921 | 4,252,240 |
| China | $3,140,747,657 | 179,799 |
| Japan | $1,352,447,186 | 161,190 |
| United Kingdom | $1,166,812,320 | 628,968 |
| Germany | $863,800,129 | 399,117 |
| India | $732,288,613 | 266,691 |
| Canada | $583,510,780 | 395,003 |
| France | $535,433,149 | 202,181 |
| Republic of Korea | $526,679,311 | 35,885 |
| Netherlands | $444,493,371 | 165,640 |
The United States spends $8.4 billion on ecommerce platforms, which is about 37% of global spending. An increasing number of buyers are using commerce applications in the US every year, with more than 4.2 million installations detected. China, Japan, and the United Kingdom are the next top spenders. The UK also has the second highest number of installations (628,968).
Only North America, Europe, and the Asia Pacific region are represented on the leader list. No African or Latin American countries are spending enough in the ecommerce industry to make the top ten.
Ecommerce platform market share
The 10 leading vendors for ecommerce platforms
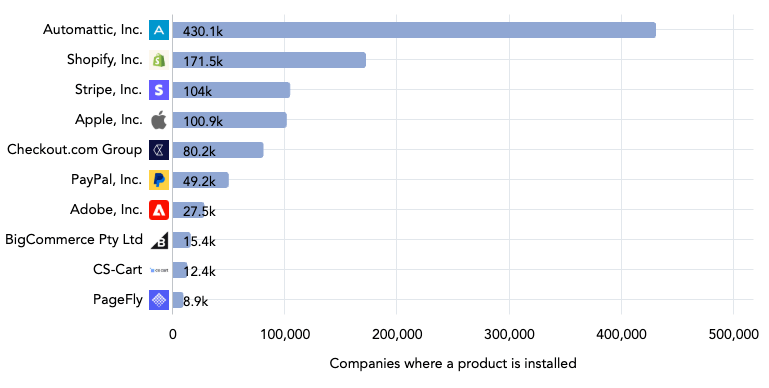
Automattic, Inc. is the vendor with the most ecommerce platform market share (by number of customers), with 430,107 detected installations. Automattic is the parent company behind online platforms WordPress.com, Woo, Jetpack, Tumblr, and other products, but WooCommerce – an open-source ecommerce plugin for WordPress – is their key market offering.
The 10 leading ecommerce platforms
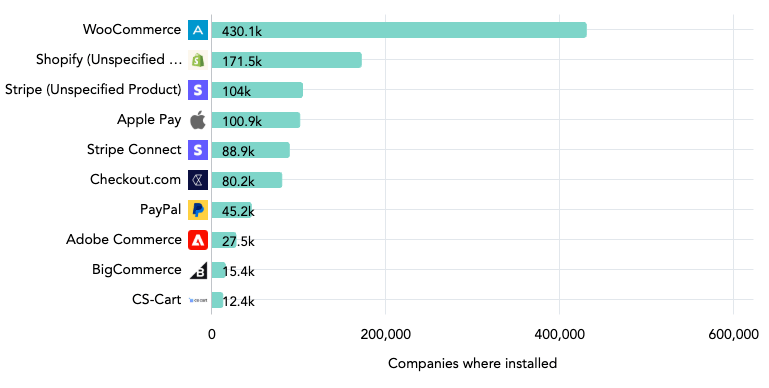
The 10 leading ecommerce platforms in this chart largely match the leading vendors that sell them. Stripe – like some other top ecommerce platforms not on this list – offers multiple tools, meaning their total customer base for this sector is spread across various products.
Ecommerce platform buyer landscape
Total ecommerce platform spending by company size (revenue)
| Revenue | Total Spend | Companies |
| $5bn+ | $11,569,471,776 | 6,422 |
| $1bn to $5bn | $4,076,891,621 | 21,918 |
| $500m to $1bn | $1,662,274,844 | 28,594 |
| $200m to $500m | $1,976,000,541 | 65,927 |
| $100m to $200m | $1,332,925,032 | 91,020 |
| $50m to $100m | $1,057,745,981 | 169,833 |
| $10m to $50m | $485,647,102 | 991,183 |
| $1m to $10m | $93,187,589 | 4,190,255 |
| Less than $1m | $16,808,291 | 2,162,600 |
As is often the case with IT spending, the majority of spend on ecommerce platforms comes from the largest companies (those with the highest revenue), even though there are fewer of them. HG data finds 6,422 companies earning more than $5 billion in annual revenue that spend a total of $11.6 billion on ecommerce platforms – more than half (51%) of all spend.
There are 4.2 million companies in the $1 million to $10 million revenue range. They make up the largest segment but only account for 0.4% of the ecommerce platform market size.
Ecommerce platform spending by company size (employees)
| Employees | Total Spend | Companies |
| 10,000+ | $9,922,109,201 | 13,427 |
| 5,000 to 9,999 | $2,067,061,483 | 14,387 |
| 1,000 to 4,999 | $4,757,162,123 | 100,653 |
| 500 to 999 | $1,639,305,290 | 93,117 |
| 200 to 499 | $1,595,815,669 | 312,604 |
| 50 to 199 | $1,259,257,400 | 911,836 |
| 1 to 49 | $649,847,251 | 5,515,307 |
The bulk of spending on ecommerce platforms comes from companies with more employees – many of which fall in the higher revenue tiers, illustrating the connection between these trends (see the “spending by company size” chart above). The 27,814 companies with more than 5,000 employees make up more than half (53%) of total spending on ecommerce platforms.
Total ecommerce platform market size by industry
| Industry | Total Spend | Companies |
| Finance and Insurance | $5,824,471,178 | 332,803 |
| Manufacturing | $4,454,034,902 | 679,143 |
| Public Administration | $3,400,660,883 | 185,175 |
| Professional, Scientific, and Technical Services | $1,899,708,788 | 1,306,015 |
| Health Care and Social Assistance | $1,293,593,674 | 357,345 |
| Information | $1,126,748,610 | 427,367 |
| Retail Trade | $860,214,815 | 398,004 |
| Educational Services | $833,584,633 | 231,005 |
| Wholesale Trade | $786,382,037 | 254,602 |
| Transportation and Warehousing | $724,024,425 | 119,415 |
| Administrative and Support and Waste Management and Remediation Services | $374,064,025 | 263,817 |
| Utilities | $323,667,601 | 30,266 |
| Construction | $184,836,364 | 304,742 |
| Mining, Quarrying, and Oil and Gas Extraction | $164,990,711 | 33,842 |
| Real Estate and Rental and Leasing | $113,688,266 | 211,480 |
| Accommodation and Food Services | $77,296,498 | 206,387 |
| Arts, Entertainment, and Recreation | $75,278,192 | 242,215 |
| Other Services (except Public Administration) | $25,265,980 | 436,218 |
| Agriculture, Forestry, Fishing and Hunting | $21,292,067 | 37,154 |
HG’s data shows that the Finance & Insurance, Manufacturing, and Public Administration sectors spend the most on ecommerce platforms. Finance & Insurance and Public Administration both have high spend ($5.8 billion and $3.4 billion, respectively) and a relatively low company count, which indicates a high average spend per company.
The Manufacturing industry spends $4.5 billion, which is the second highest amount among all industries. Spending is spread across 679,143 companies, second only to the Professional, Scientific, & Technical Services industry.
Leveraging ecommerce market intelligence to accelerate growth
With $22.6 billion in revenue up for grabs, leveraging ecommerce platform market intelligence can help you uncover accounts with the highest likelihood to buy your products.
In this step-by-step video, Brett Castonguay, Customer Success Manager, shows how HG’s Platform deep dives into the ecommerce market to reveal opportunities in this sector.
The HG Platform enables users to see which companies are using specific ecommerce platforms and drill down into spend categories to pinpoint where the best opportunities lie. Our data illustrates in granular detail where usage signals are coming from by company location, department, product, and more. Choose from more than 9000 intent topics to understand where a user is in the buyer’s journey, enabling a more effective sales and marketing strategy and personalized customer experience.
Ready to see how it works? Request a personalized demo and let us show you the power of our ecommerce market intelligence and how we leaped an unprecedented 74 spots to become a Momentum Leader in both of G2’s Sales Intelligence and Marketing Account Intelligence categories.