

Key Takeaways:
- $138.3 billion in projected spend on Business Process Outsourcing (BPO) in the next 12 months.
- 42% of BPO spending comes from the AMER region, largely from the United States.
- The leading segments within the BPO market include Analytics / Business Intelligence, Customer Relationship Management (CRM) BPO, Processing Services, Finance and Accounting (F&A) BPO, and Human Resources (HR) BPO.
- 53% of spend on the BPO industry comes from companies with revenue of $5 billion or more.
Business Process Outsourcing (BPO) is a key subcategory of global IT spend, accounting for 7% of IT Services and 3% of total external IT spend.
BPO involves contracting operations and responsibilities of an enterprise’s non-primary business processes to a third-party provider. This can encompass a wide range of services, from outsourced call centers to the administration of finance and accounting activities to the broader procurement outsourcing market. With Business Process Outsourcing services, companies can streamline operations, improve cost-effectiveness, and gain efficiency by handing off non-core tasks to specialized service providers.
This report is based on HG’s research on the BPO market and covers market size, leading vendors, and spending in the BPO market by segment. The findings are powered by the HG Insights Platform and will help you identify your distinct opportunities in the Business Process Outsourcing market.
BPO Market Size
According to HG’s data, the total BPO market size (the total spend on Business Process Outsourcing) is projected to reach $138.3 billion over the forecast period (next 12 months).
Global Business Process Outsourcing Spend (by Region)
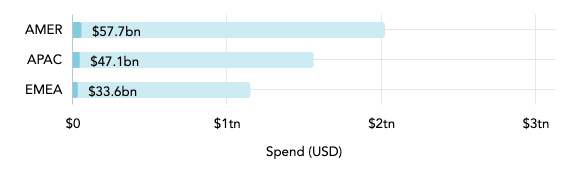
This chart shows the proportion of global Business Process Outsourcing spend (dark blue) to external IT spend (light blue) in each region.
Out of the three global regions, AMER (North America, Central America, and South America) spends the most on the BPO industry, accounting for 42% of spending. APAC (Asia Pacific) accounts for 34% of global spend and 24% comes from EMEA (Europe, Middle East, and Africa).
Top 10 Countries for the BPO Market
| Country | Spend | Companies |
| United States | $49,987,819,801 | 4,663,739 |
| China | $19,549,157,134 | 196,312 |
| Japan | $8,144,701,977 | 164,175 |
| United Kingdom | $7,224,739,316 | 676,468 |
| Germany | $5,066,588,618 | 413,310 |
| India | $4,514,469,867 | 307,554 |
| Canada | $3,807,822,663 | 431,933 |
| Republic of Korea | $3,206,718,844 | 36,644 |
| Australia | $3,102,216,240 | 343,747 |
| France | $3,046,145,398 | 208,555 |
Source: This data was uncovered with the HG Insights Platform and includes only businesses with registered addresses
According to HG’s data, nearly 4.7 million companies in the United States are projected to spend $50 billion on outsourcing services in the next 12 months. This is by far the strongest BPO market globally, making up more than 36% of total spend and with nearly 7x more buyers than the next largest market by company count (United Kingdom).
Other key markets in the BPO industry by spend include China, Japan, and the United Kingdom, accounting for 14%, 6%, and 5% of global spend, respectively.
BPO Market by Segment
There are a number of ways to divide the BPO market by segment: Service type (i.e. categories – see below), outsourcing type (i.e. onshore, offshore, nearshore), deployment (on-premise vs. cloud computing), and end user (i.e. company size, industry, etc).
BPO Market by Segment (Category)
| Category | Spend | % of Market |
| Analytics / Business Intelligence | $28,408,321,994 | 20.5% |
| Customer Relationship Management (CRM) BPO | $27,515,141,508 | 19.9% |
| Processing Services | $26,894,050,513 | 19.4% |
| Finance and Accounting (F&A) BPO | $17,371,010,392 | 12.6% |
| Human Resources (HR) BPO | $13,351,977,196 | 9.7% |
| Robotic Process Automation (RPA) | $11,408,874,387 | 8.2% |
| Procurement BPO | $5,802,938,618 | 4.2% |
| Industry-specific BPO | $3,546,308,593 | 2.6% |
| Knowledge Process Outsourcing (KPO) | $2,804,439,143 | 2.0% |
| Legal Services Outsourcing | $1,201,586,792 | 0.9% |
Source: This data was uncovered with the HG Insights Platform and includes only businesses with registered addresses
This chart segments the BPO market by category (i.e. type of BPO service). Here’s a quick breakdown of each category:
Analytics / Business Intelligence
Involves data analysis, reporting, and insights to help businesses make informed decisions and optimize operations.
- Analytics / Business Intelligence BPO market size: $28.4 billion
Customer Relationship Management (CRM) BPO
Manages customer interactions, support, and engagement through outsourced call centers, chat, and email services.
A separate but related segment is the CX-BPO market, which refers to outsourcing services that enhance the overall customer experience across various touchpoints. CX-BPO differs from traditional CRM BPO in that it takes a more holistic approach by integrating customer support, omnichannel engagement, AI-driven insights, automation, and personalization.
- Customer Relationship Management (CRM) BPO market size: $27.5 billion
Processing Services
Handles back-office tasks like data entry, transaction processing, and document management.
- Processing Services market size: $26.9 billion
Finance and Accounting (F&A) BPO
Covers financial operations, including bookkeeping, payroll, accounts payable/receivable, and financial reporting.
- Finance and Accounting (F&A) BPO market size: $17.4 billion
Human Resources (HR) BPO
Manages HR functions such as recruitment, payroll, benefits administration, and employee onboarding.
- Human Resources (HR) BPO market size: $13.4 billion
Robotic Process Automation (RPA)
Uses software bots to automate repetitive tasks like data entry, invoice processing, and compliance reporting.
- Robotic Process Automation (RPA) market size: $11.4 billion
Procurement BPO
Outsources purchasing, vendor management, and supply chain optimization.
- Global procurement outsourcing market size: $5.8 billion
Industry-specific BPO
Provides specialized outsourcing services tailored to specific industries, such as healthcare, banking, or insurance.
The healthcare BPO market, for example, offers services like medical billing, patient scheduling, telehealth support, and insurance claims processing.
- Industry-specific BPO market size: $3.5 billion
Knowledge Process Outsourcing (KPO)
Focuses on high-value tasks requiring expertise, such as research, data analysis, and risk management.
- Knowledge Process Outsourcing (KPO) market size: $2.8 billion
Legal Services Outsourcing
Covers legal support services, including contract management, compliance, litigation support, and patent research.
- Legal Services Outsourcing market size: $1.2 billion
BPO Market by Segment (Company Size – Revenue)
| Revenue | Spend | Companies |
| $5bn+ | $72,864,906,938 | 7,179 |
| $1bn to $5bn | $25,781,582,352 | 23,568 |
| $500m to $1bn | $9,878,351,196 | 29,320 |
| $200m to $500m | $11,478,071,808 | 67,418 |
| $100m to $200m | $7,476,815,427 | 91,750 |
| $50m to $100m | $5,979,204,823 | 170,964 |
| $10m to $50m | $2,753,418,694 | 1,044,349 |
| $1m to $10m | $578,660,459 | 4,502,145 |
| Less than $1m | $130,772,933 | 2,418,958 |
Source: This data was uncovered with the HG Insights Platform and includes only businesses with registered addresses
This chart illustrates BPO market segments by revenue tier. According to HG data, about 7,179 large enterprises earning more than $5 billion in annual revenue account for more than half (53%) of the global BPO market size.
Over one-quarter (25.2%) of spending on BPO services – a tier worth $34.8 billion – comes from the 359,452 BPO buyers with revenue between $50 million and $1 billion.
BPO Market by Segment (Company Size – Employees)
| Employees | Spend | Companies |
| 10,000+ | $59,247,425,677 | 14,379 |
| 5,000 to 9,999 | $12,873,894,875 | 15,012 |
| 1,000 to 4,999 | $29,778,316,189 | 103,467 |
| 500 to 999 | $9,969,032,831 | 94,030 |
| 200 to 499 | $10,265,020,942 | 335,512 |
| 50 to 199 | $9,010,083,049 | 964,926 |
| 1 to 49 | $5,618,646,292 | 6,202,019 |
Source: This data was uncovered with the HG Insights Platform and includes only businesses with registered addresses
This chart shows spending on the BPO industry by company size (number of employees). As with most sectors, large enterprises (by number of employees) tend to account for the highest overall volume of spending. The 14,379 companies with more than 10,000 employees are projected to spend $59.2 billion in the next 12 months – 43% of all BPO spending.
Although enterprises in the 3rd size tier (1,000 to 4,999 employees) spend more overall than those in the second tier (5,000 to 9,999 employees), that spend is spread across nearly 7x more buyers, indicating a lower average spend per company.
BPO Market by Segment (Industry)
| Industry | Spend | Companies |
| Finance and Insurance | $51,144,179,457 | 348,622 |
| Manufacturing | $22,248,883,367 | 704,353 |
| Public Administration | $16,147,722,414 | 193,480 |
| Professional, Scientific, and Technical Services | $11,587,168,952 | 1,373,574 |
| Health Care and Social Assistance | $7,070,224,438 | 378,105 |
| Information | $6,129,588,006 | 449,957 |
| Retail Trade | $4,800,861,958 | 424,224 |
| Wholesale Trade | $4,041,732,161 | 265,212 |
| Utilities | $3,133,361,091 | 30,561 |
| Transportation and Warehousing | $2,671,283,514 | 124,768 |
| Educational Services | $2,589,035,663 | 242,151 |
| Administrative and Support and Waste Management and Remediation Services | $2,233,659,502 | 282,304 |
| Mining, Quarrying, and Oil and Gas Extraction | $1,807,952,401 | 35,067 |
| Construction | $824,541,213 | 319,582 |
| Real Estate and Rental and Leasing | $605,705,245 | 225,383 |
| Arts, Entertainment, and Recreation | $525,575,338 | 259,564 |
| Accommodation and Food Services | $449,684,622 | 224,531 |
| Other Services (except Public Administration) | $165,937,885 | 462,212 |
| Agriculture, Forestry, Fishing and Hunting | $127,563,104 | 39,481 |
Source: This data was uncovered with the HG Insights Platform and includes only businesses with registered addresses
In keeping with the market dynamics for many other IT spend categories, four industries are spending the most on BPO services: Finance and Insurance; Manufacturing; Public Administration; and Professional, Scientific, and Technical Services. Together, these sectors account for nearly three-fourths (73%) of projected spend.
While Professional, Scientific, and Technical Services has the 4th highest spend, it also has by far the largest company count, putting the sector on the lower end for average spend. The Utilities industry, meanwhile, has lower overall spend, but higher average spend per company.
Uncover BPO Market Opportunities with HG Insights
With the HG Platform, go-to-market (GTM) teams can turn insights like the ones in this report into revenue-driving actions. Our all-in-one platform enables every level of GTM planning and execution, from market-level analysis all the way down to account-level detail.
HG offers unparalleled data reach:
- 7.2B+ source files
- 9M+ companies and growing
- 6 continents & 100 countries
- 2B intent records
- 101M+ current technology installs
- 203M+ all-time technology installs
- 140+ IT spend categories
- 12k+ contract vendors
Analyze vendor penetration, identify ICP accounts, size markets, uncover white space opportunities, and prioritize your best-fit accounts – all in one place. To get started, request a free data sample to see your ICP accounts and spot opportunities in the BPO market.