Key Takeaways:
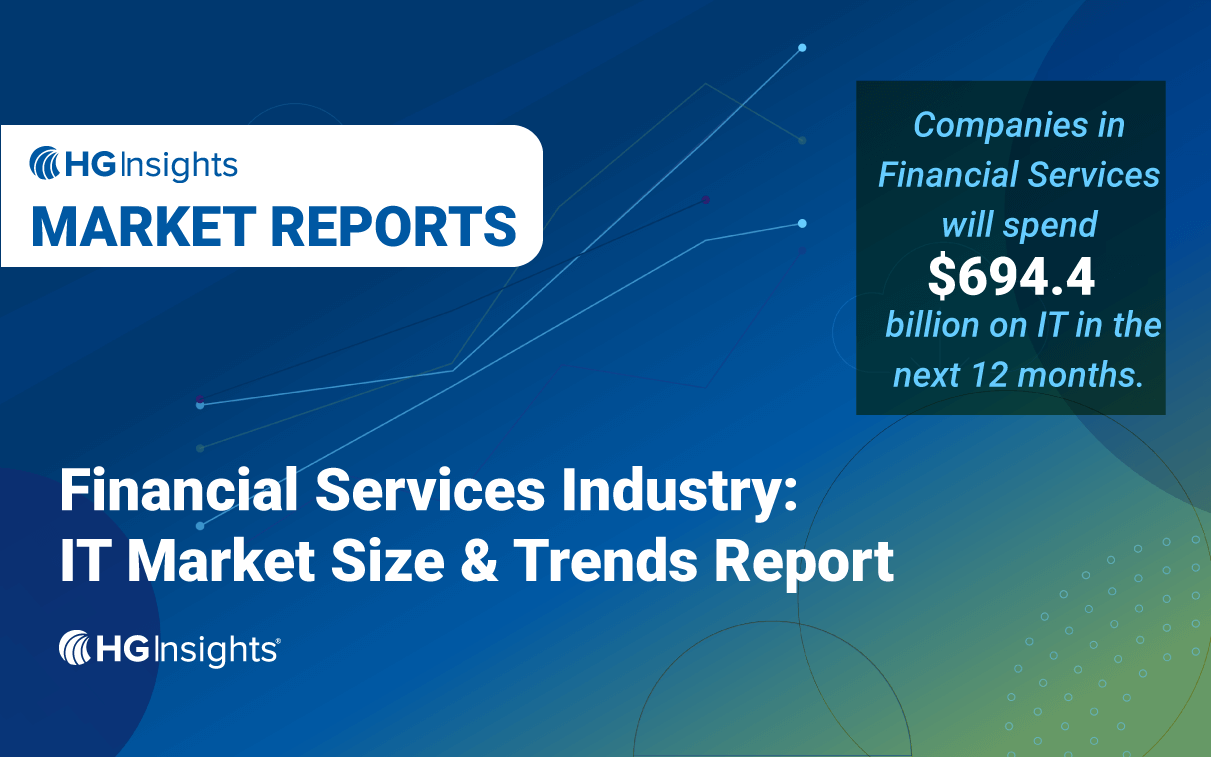
- $694.4 billion in projected IT spend by Financial Services organizations in the next 12 months
- 42% of the Financial Services market size for IT comes from the APAC region
- 53% of Financial Services IT spend comes from companies with a revenue of $5 billion or more
The global Financial Services industry covers a vast range of sub-categories, including banking, credit cards, mortgages for real estate, private equity, investment banking, payments, mutual funds, wealth management, tax preparation and planning, insurance companies, investing, venture capital, accounting, and more.
Financial institutions in these areas require support from every corner of the IT market, and our data illustrates the impressive level of investment in technology infrastructure, software, and services: According to HG’s data, companies in the Financial Services industry will spend $694.4 billion on IT in the next 12 months.
Exciting technology trends like generative AI are shaking things up. At the same time, macroeconomic trends like high interest rates continue to perpetuate uncertainty – impacting how those financial firms spend money on things like IT.
This report provides research on IT spending and usage in the global Financial Services industry and covers the leading vendors, solutions, buyer profiles, and more. This data was uncovered with our Market Intelligence Platform to help you identify your distinct opportunities in the market.
Financial Services Market Size for IT
According to HG’s data, the global Financial Services market size for IT is projected to reach $694.4 billion over the next 12 months. Out of the 4.3 million companies in the HG database, our data analysis identifies approximately 175,000 Financial Services companies buying IT solutions (this data includes only businesses with registered addresses).
IT Spend in Financial Services Industry (by Region)
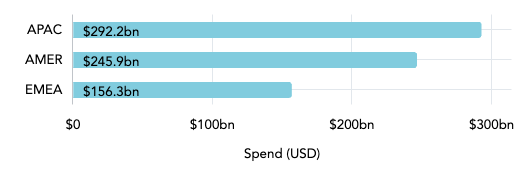
Financial Services companies in APAC (Asia Pacific) will spend over $292 billion on IT in the next 12 months, accounting for 42% of global spend. AMER (North, Central, and South America) accounts for 35% of global spend and 23% comes from EMEA (Europe, Middle East, and Africa).
Financial Services Market Size for IT (by Country)
Country Companies Total Spend ($) Percentage of global spend
United States of America 70,717 $195,417,630,712 28.14
China 6,829 $145,272,990,432 0
Japan 2,376 $41,060,785,599 0
India 6,444 $38,807,089,922 0
United Kingdom 16,034 $31,707,005,233 0
Canada 6,505 $22,174,413,851 0
Germany 5,306 $19,366,420,436 0
South Korea 628 $15,157,611,844 0
Netherlands 6,5000 $18,558,317,894 0
Brazil 2,707 $10,777,063,363 0
The United States is the largest market for IT spending in the Financial Services sector, with approximately 71,000 companies projected to spend $195.4 billion on IT in the next 12 months. The next three largest markets all hail from the APAC region: China ($145.3 billion), Japan ($41.1 billion), and India ($38.8 billion).
IT Buyer Landscape in the Financial Services Industry
It’s clear from the data that there is a significant amount of revenue up for grabs among companies in the Financial Services industry. But who are these buyers and how are they spending across different categories of IT?
This section digs into the buyer landscape of the Financial Services sector, including their top IT investments by category, the number of buyers (classified by company size in employee count and revenue), and their projected spend.
Financial Services Industry Trends in IT (by Category)
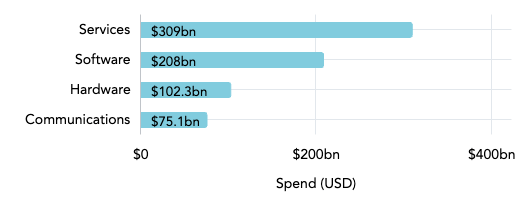
IT Services is the largest category for Financial Services buyers, with $309 billion in projected spend — over 44% of the $694.4 billion market. Across the other three categories, 30% will be spent on Software, 15% on Hardware, and 11% on Communications.
Financial Services IT Spending by Company Size (Number of Employees)
Employees Range Total Spend ($) Total Companies
10,000 and above 330,139,832,901 832
5,000 to 9,999 58,259,656,855 789
1,000 to 4,999 146,115,350,203 4,734
500 to 999 46,537,900,761 4,594
200 to 499 43,505,756,268 8,160
50 to 199 39,715,459,303 17,026
1 to 149 13,944,859,227 73,166
The largest tiers for IT spend in the Financial Services industry are companies with greater than 10,000 employees ($330.1 billion), and those with 1,000 to 4,999 employees ($146.1 billion). However, more than two-thirds (66.9%) of IT buyers in Financial Services are small companies, with 49 employees or fewer.
Financial Services IT Spending by Company Size (Revenue Range)
Company Revenue Range Total Spend ($) Total Companies
$5bn and above 370,034,803,969 507
$1bn to $5bn 136,506,366,756 1,597
$500m to $1bn 51,050,099,100 1,693
$200m to $500m 58,505,766,586 3,807
$100m to $200m 37,092,291,943 4,885
$50m to $100m 25,865,676,262 8,111
$10m to $50m 10,080,261,836 32,245
$1m to $10m 1,517,094,120 84,141
Less than $1m 160,585,932 28,026
More than half (53%) of IT spending in the Financial Services industry – $370 billion – comes from companies making more than $5 billion in revenue. But only 507 buyers fall in this revenue tier, equating to a whopping $730 million in average spend per buyer.
The largest set of buyers are the 144,412 companies making less than $50 million in revenue. They account for about 1.7% of IT spending in this industry.
Financial Services Industry Trends in Technology
With so much IT spend up for grabs in the Financial Services industry, vendors across all categories are battling to win a slice of the $694 billion pie. This section explores the leading vendors and products in five trending IT categories for Financial Services buyers: Cloud Services, Security Software, Core ERP, Database Management, and Business Intelligence.
Leading Cloud Services Vendors and Products
Top Cloud Services Vendors
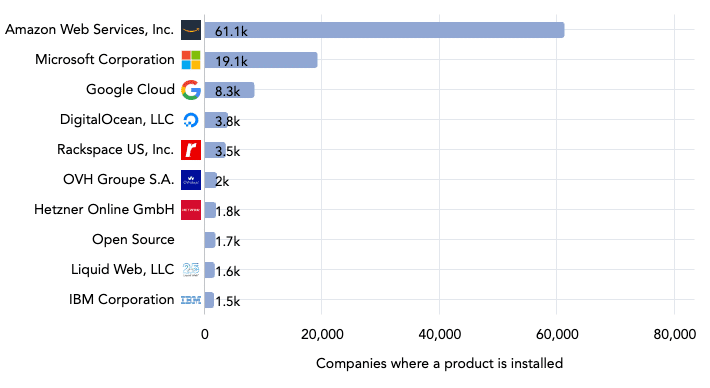
The ten Cloud Services vendors with the most Financial Services installations are shown in this chart. It’s no surprise that the three largest cloud companies – Amazon Web Services (AWS), Microsoft, and Google Cloud Platform – are leading the pack in this category. AWS has by far the largest customer base, with 61,115 Financial Services customers, more than three times that of the next highest vendor.
We’ve covered the so-called “Cloud Wars” between the big three cloud companies extensively in our market reports. Read more below:
- The AWS Ecosystem in 2024
- The Microsoft Azure Ecosystem in 2024
- The Google Cloud Platform Ecosystem in 2024
Top Cloud Services Products
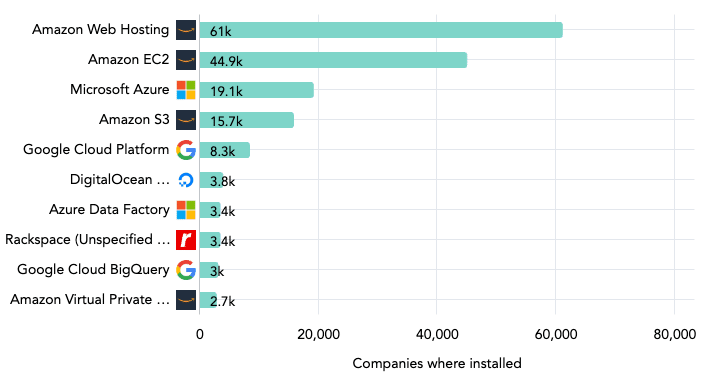
When we break down the Cloud Services market into individual products, AWS is still a clear winner, capturing five out of the top ten spots. The products in this list are not mutually exclusive and many are bundled or purchased together, which explains why the top AWS products each have relatively high installation counts.
Many companies (Financial Services organizations included) adopt a multi-cloud strategy, meaning they may have a variety of products from multiple vendors installed at a given time.
Leading Security Software Vendors and Products
Top Security Software Vendors
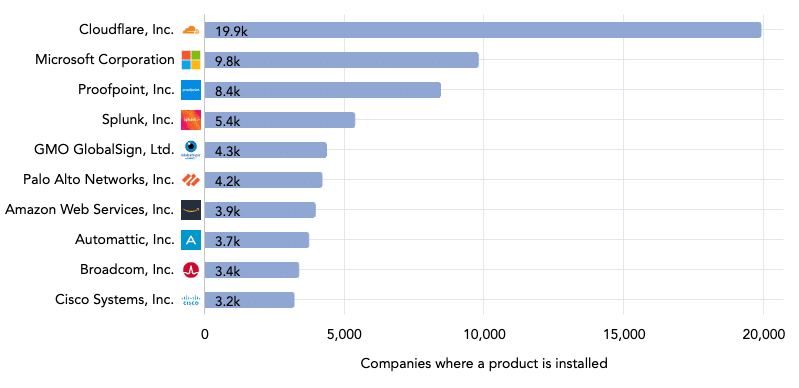
Security is a vitally important issue in the Financial Services sector, as these companies must protect against cyberattacks and fraud; ensure compliance with regulations; and process and store highly sensitive customer data, which needs to remain secure for a great customer experience. For this analysis, we identified the top vendors across the three security software categories: Identity and Access Management, Information and Threat Management, and Vulnerability Management.
Cloudflare is the clear leader by number of installs with nearly 20,000 customers. Other leaders include Microsoft (9,776), Proofpoint (8,427), and Splunk (5,354).
Top Security Software Products
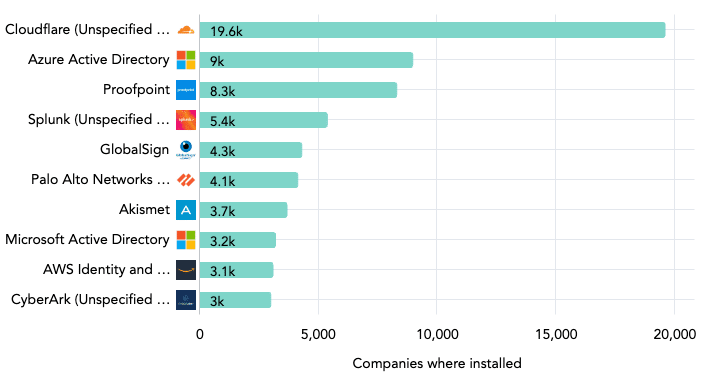
When we break Security Software down into individual products, the top five by installations align almost exactly with the top five vendors who sell them: Cloudflare (19,581), Microsoft Azure Active Directory (8,953), Proofpoint (8,280), Splunk (5,354), and GlobalSign (4,285). =
Learn more in our Cloud Security Market Report →
Leading Core ERP Vendors and Products
Top Core ERP Vendors
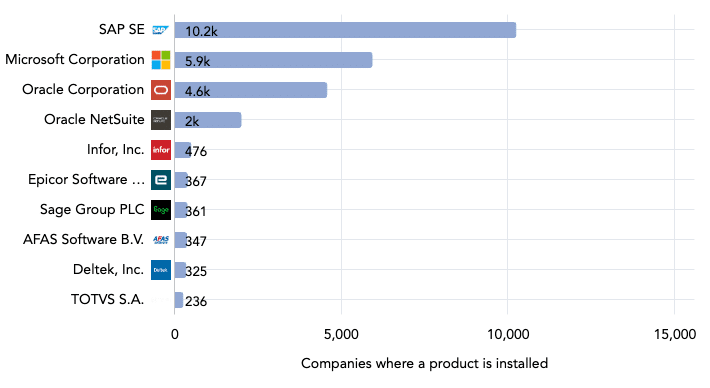
Enterprise Resource Planning (ERP) systems are some of the stickiest products in which any company will invest. Among Financial Services firms, leading vendors include SAP (10,226 installs), Microsoft (5,910), and Oracle (6,528 installs when combining Oracle and NetSuite).
Top Core ERP Products
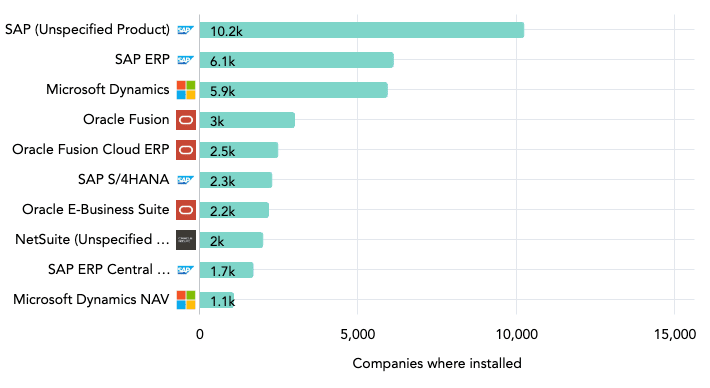
The top Core ERP products in the Financial Services industry come from the three leading vendors:
- SAP – ERP, S/4HANA, ERP Central Component (ECC), etc.
- Microsoft – Dynamics and Dynamics NAV
- Oracle – Fusion, Fusion Cloud ERP, E-Business Suite, Netsuite
Learn more about this category in our ERP Market Report →
Leading Database Management Vendors
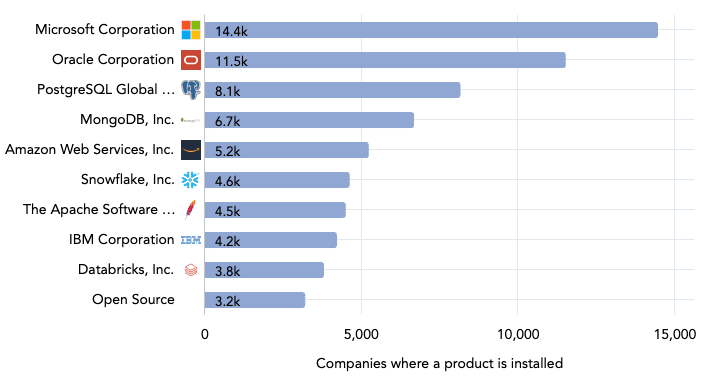
Among Financial Services firms, the most used vendors of Database Management solutions are Microsoft (14,443 installs), Oracle (11,501), and PostgreSQL Global Development (8,137).
Leading Business Intelligence Vendors
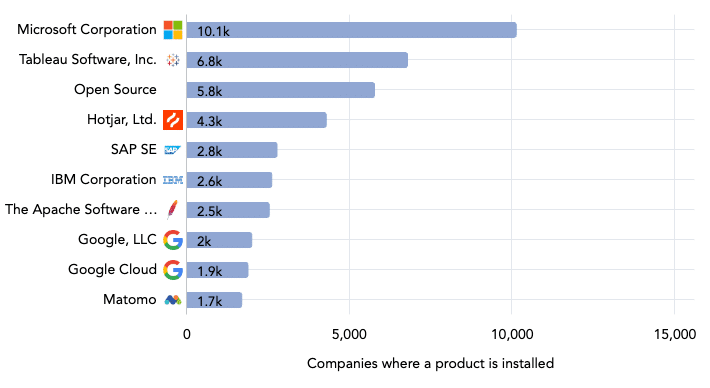
Microsoft – the developer of Power BI – tops the Business Intelligence (BI) vendors list with 10,117 installs at Financial Services companies. Other key players include Tableau (6,778 installs), Hotjar (4,281), and SAP (2,770).
One of the largest Business Intelligence “vendors” by number of installs (5,766) is not a vendor at all, but a combination of all open-source BI solutions.
Want to learn more about leading the leading providers and products? Check out our Business Intelligence market report →
Uncover Financial Services Opportunities with HG Insights
All of the data and insights in this report were uncovered using the award-winning HG Market Intelligence platform, which enables go-to-market teams to uncover the answers they need, whether it’s identifying their Ideal Customer Profile, sizing their Total Addressable Market (TAM), planning sales territories, developing marketing campaigns, or equipping investors in capital markets to get ahead of the competition.
Unlock HG’s data to uncover your distinct opportunities in the Financial Services industry. Schedule a demo with one of our solutions experts to see your best-fit accounts and capitalize on these Financial Services trends in IT.


